First, the trading method that was refined through past analysis, yielding a rebound rate of 56.7% on the 1-hour chart using the 20 SMA, is as follows.
- Verify the rebound at the 1-hour moving average (SMA).
- The setting value of the moving average line is `20`.
- A touch is considered to be within ±10 pips above or below 20sma.
- A rebound is determined when the price moves by +50 pips or more in the rebound direction.
- The 20sma is not horizontal, but is facing either up or down.
- Entry decisions and entries are made in 5 minutes.
- The timing should be advantageous based on the Dow theory seen on a 5-minute chart.
- The direction of the 5-minute 20sma must be firmly in the direction you are aiming for.
- The price has broken out in the desired direction from the 5-minute 20 SMA and is confirmed.
- The stop loss points are the most recent high and low prices of the Dow Theory on a 5-minute chart.
- Risk reward should be at least 1:1.5.
However, this is based on analysis results from completed historical charts, and the period analyzed only covers the most recent one or two months.
Therefore, to verify whether this trading method can be applied to “live charts” and “whether it can work in any market condition,” it is necessary to test it using backtesting software that allows real trades based on actual historical data.
記事の目次
Results of the First Backtest of the 56.7% Win Rate Trading Strategy
The currency pairs and periods tested are as follows.
| Currency pair | GBPJPY |
| Historical data period | January 1, 2019 – June 30, 2019 |
| Verification start period | February 1, 2019 – June 30, 2019 |
And here are the results of the first test.
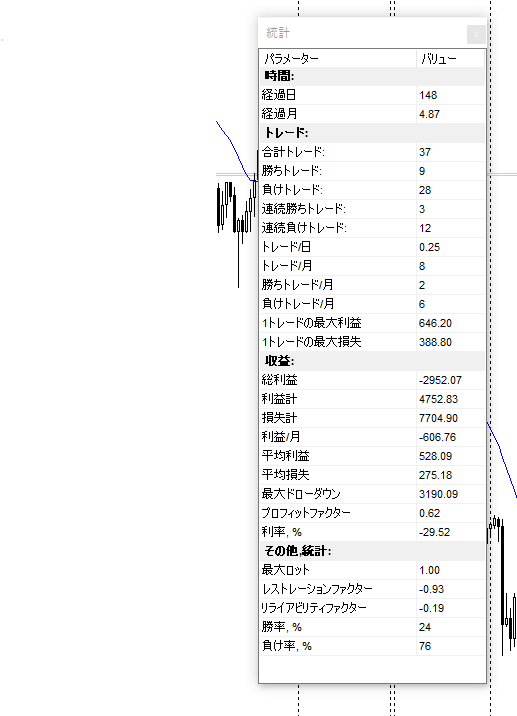
| Number of trades | 37 times |
| Winning trade | 9times |
| Losing trade | 28times |
| Winning rate | 24% |
| Net profit | -$2952.07 |
It was a complete loss, and the results did not match the analysis at all.
Some losing trades came close but couldn’t reach the take-profit level, and then the market turned, resulting in stop-losses. That said, this is not a trading strategy that can be used for live trading (´;ω;`).
Analyzing Losing Trades from the Backtest History
As it stands, this strategy is far from being usable in actual trading, so I plan to analyze the losing trades further and strengthen the trading rules to avoid making the same mistakes.
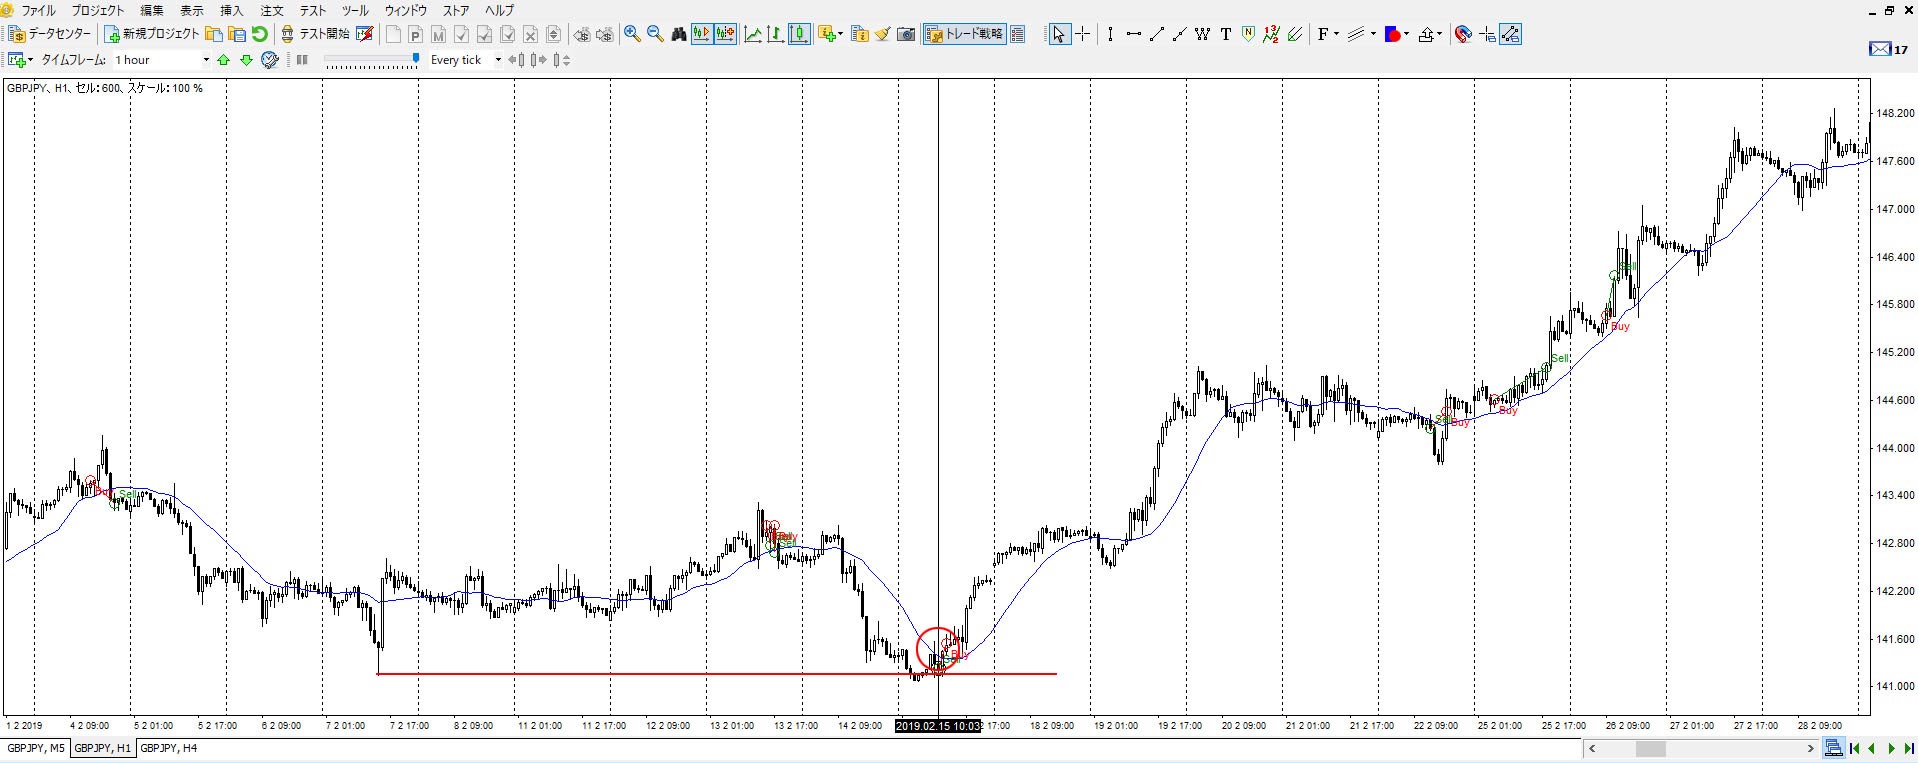
Analysis of the losing trade on February 15, 2019, at 10:00
As you can see from the chart, the low point at 14:00 on February 7, 2019, is recognized as a support line.
Despite this, I entered a short trade, ignoring this support line because it wasn’t part of the original trading rules. I believe this was the reason for the loss.
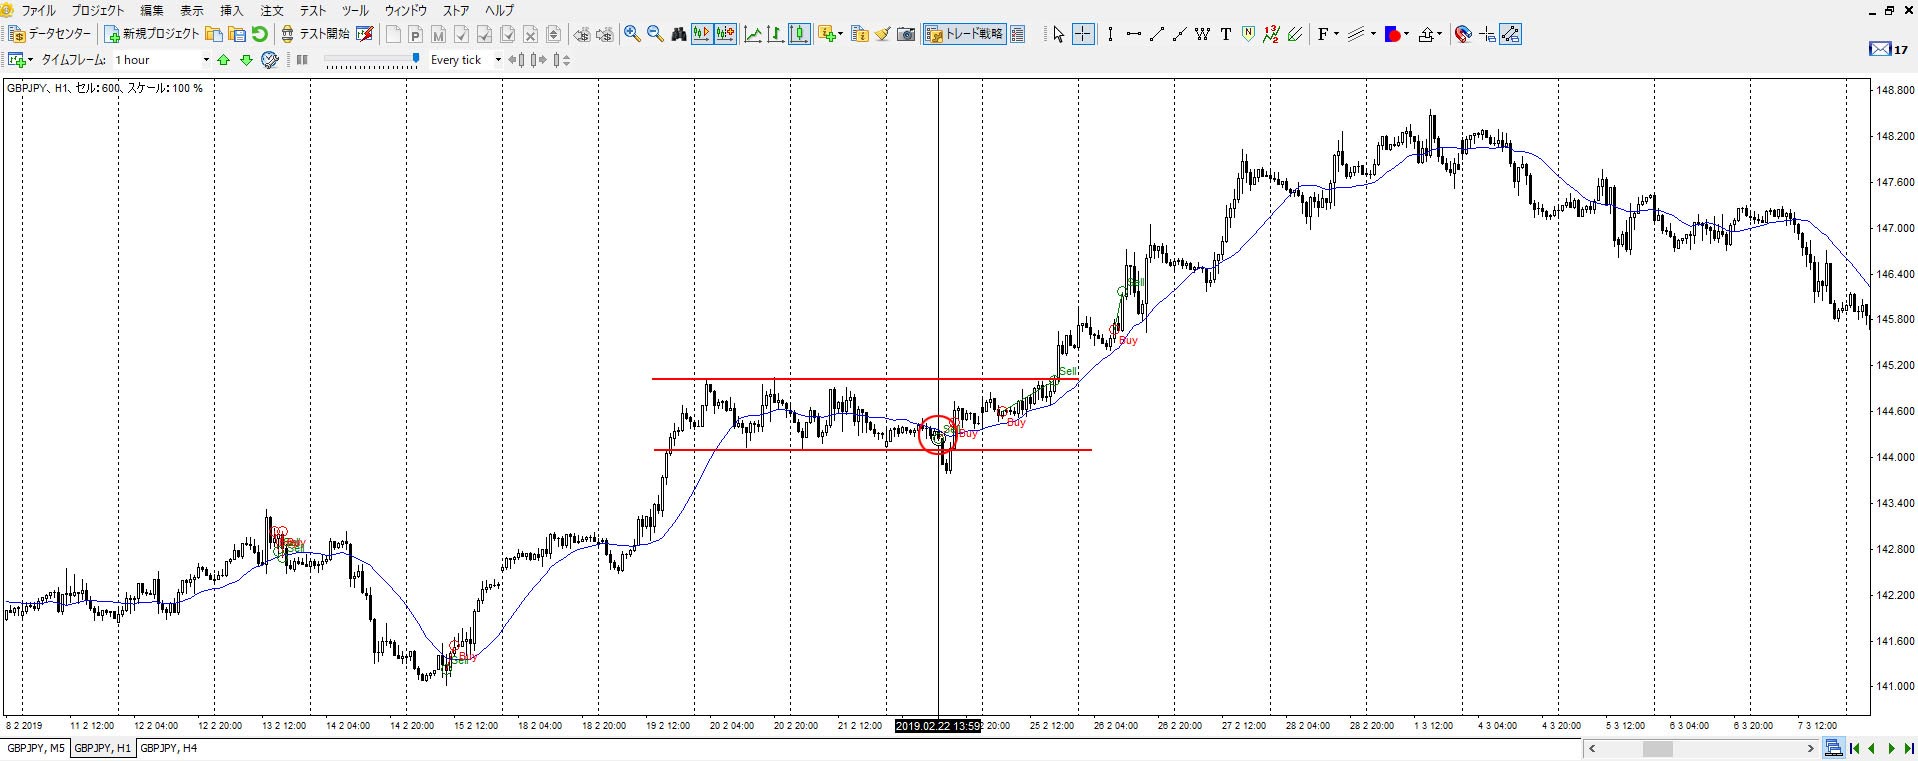
Analysis of the losing trade on February 22, 2019, at 14:00
Here, I think the reason for the loss was entering a short trade despite a clear range market forming in the middle of an uptrend. Also, the angle of the 20 SMA is flat, which also indicates a range market.
The original trading rule states, “The 20 SMA should be sloping either up or down, not flat.” Since I didn’t adhere to this rule, I consider this a mistrade.
Analysis of the losing trade on March 14, 2019, at 14:32
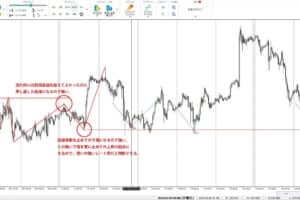
At first glance, this trade seems to be based on a higher low and a higher high, suggesting a bullish outlook, with the 20 SMA also sloping upwards, which seems promising. However, you can see that the high from March 1, 2019, at 16:00 (marked by a red line) is acting as a resistance.
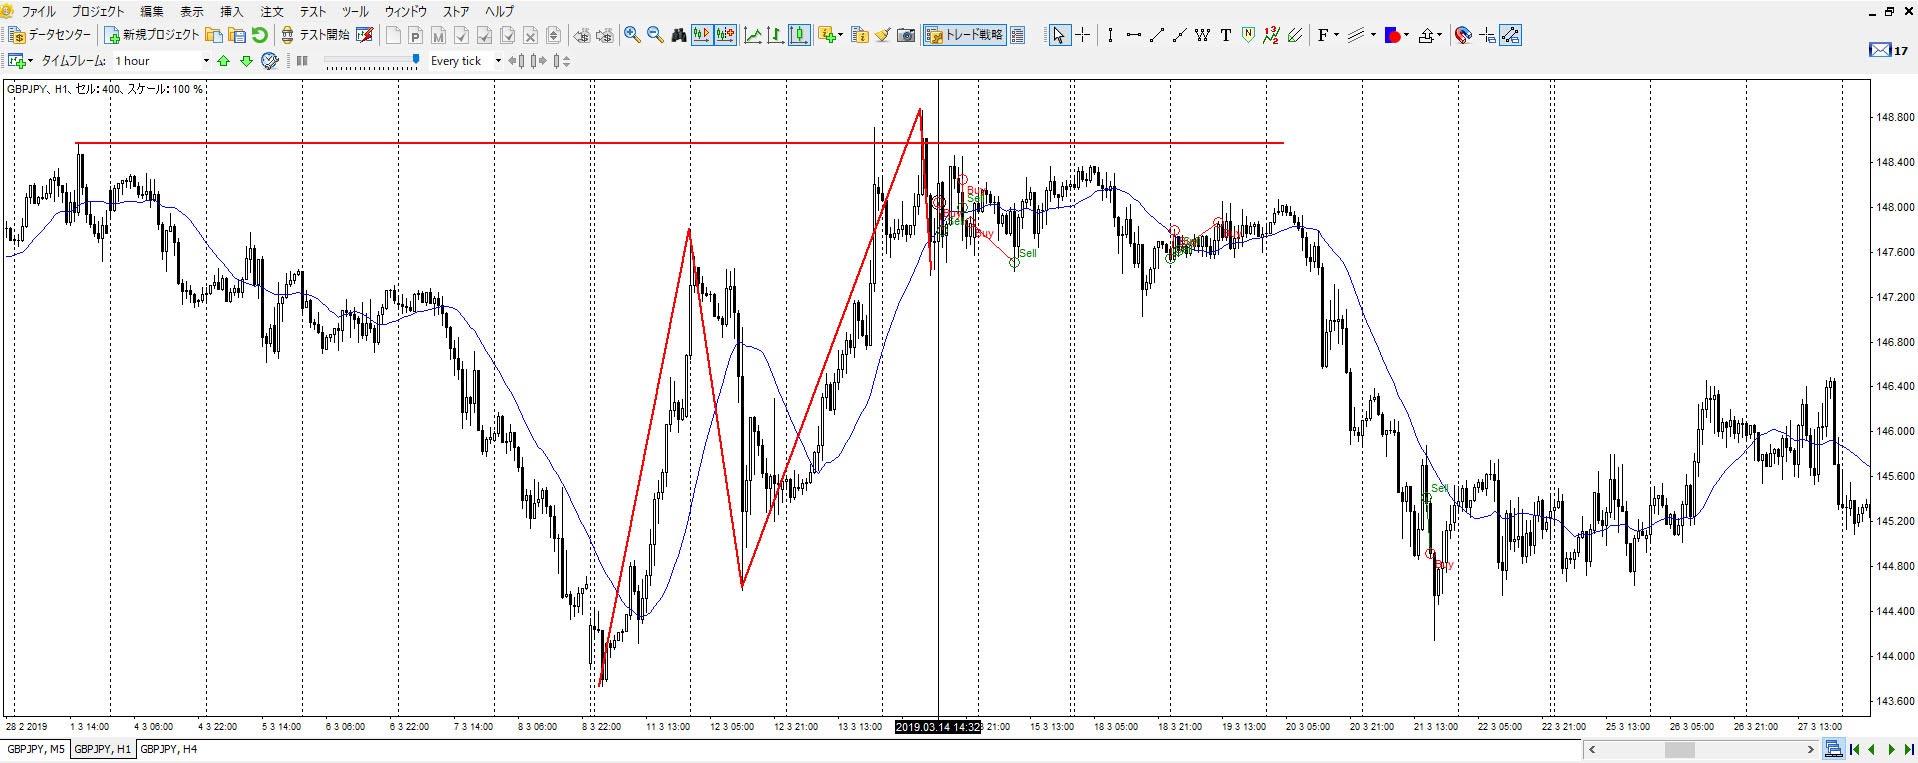
Let’s check this trade on the 5-minute chart.
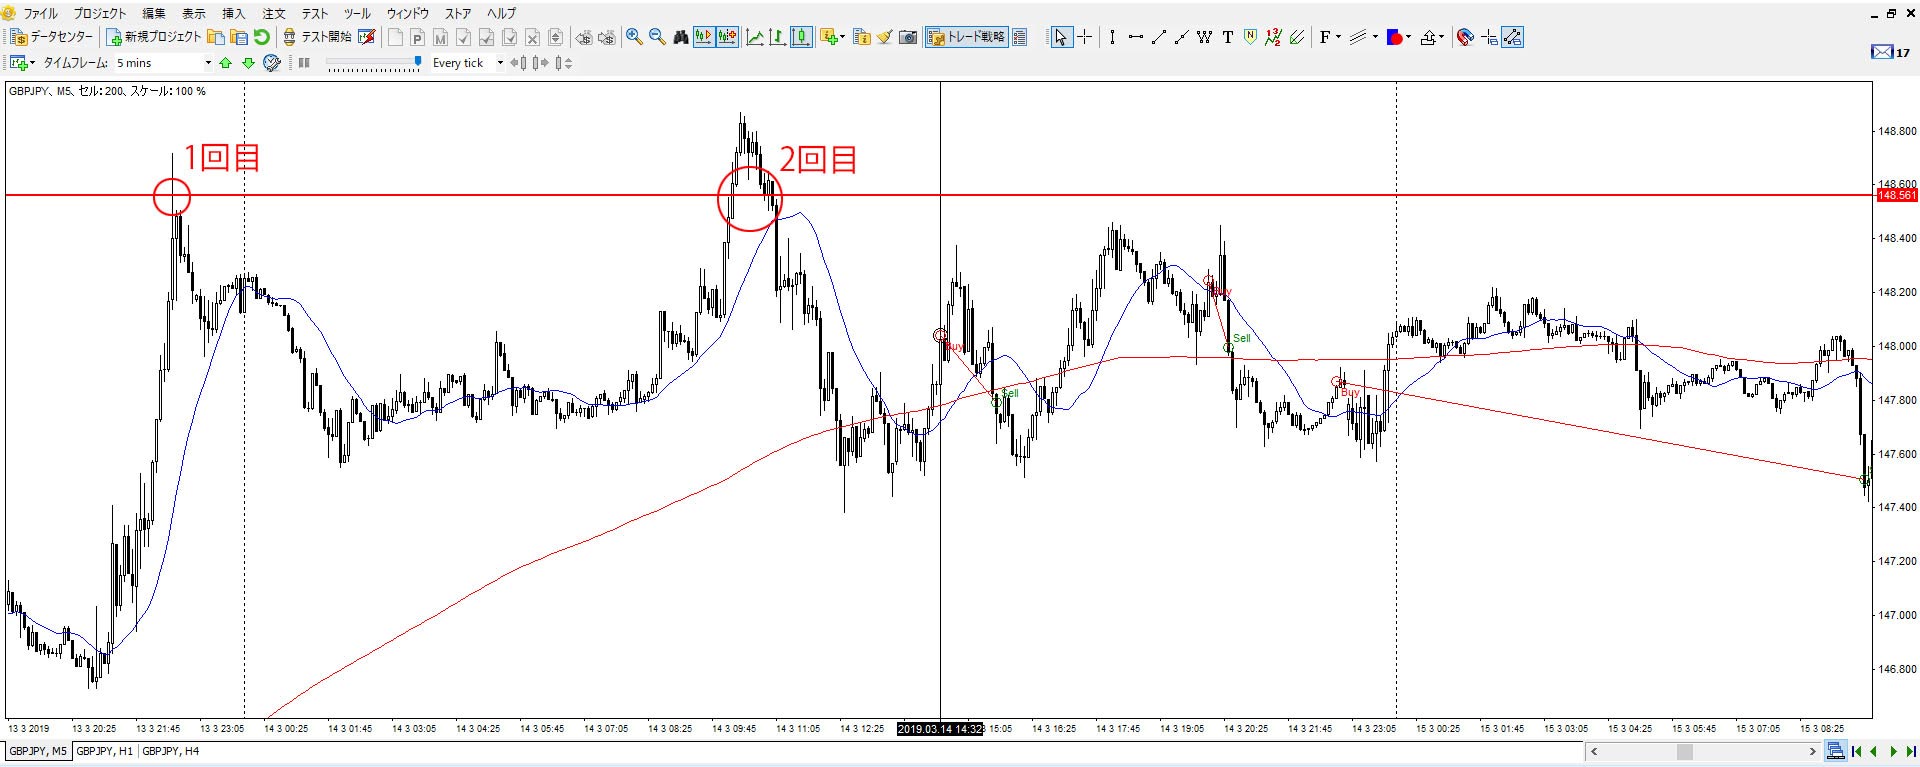
It attempted to break through this high twice. The first time, it failed to break through with just a wick, and the second time, although the price broke through with the body of the candle, it quickly reversed with significant downward momentum.
After forming what looks like a double bottom or an inverse head-and-shoulders pattern, I entered the trade when it broke through the neckline. However, considering the number of pips left to the already well-established resistance line, the risk-to-reward ratio no longer made sense.
While one might hope for a breakout on the third attempt, in this case, it would have been more reasonable to wait for a confirmed breakout of the resistance line before entering the trade. Therefore, I consider this trade a failure as well.
Moreover, since I made two more entries in quick succession after this, these were completely wasted losing trades.
Summary of the First Backtest of Moving Average Rebounds Using Backtesting Software
I haven’t included it here, but after analyzing the other losing trades (28 in total), I concluded that by adding the following entry rule, unnecessary losing trades could be reduced:
“There should be no price range (line) that is likely to act as a resistance in the direction you are targeting.”
Of course, it’s hard to know exactly which price range will act as resistance and which won’t. However, since this is simply an additional rule to “reduce trades with a high probability of losing,” I think it’s fine.
At this stage, the trading strategy is not yet at a level that can be used, but by continuing to backtest like this and adjust the trading rules, I believe it will gradually evolve into a profitable trading strategy.
In the next article, I will introduce the results of further backtesting, including the newly added rule, so I’d appreciate it if you could check it out as well.
There are also articles where I’ve analyzed moving average rebounds up to this point, so feel free to reference them if you like.

I highly recommend the FX backtesting software I use, as it allows for more efficient backtesting.
23 Years of Actual Historical Data
Tick Data for Timeframes Below 1 Minute
Comprehensive Support System


の使い方を分析してみたら勝率56.7のトレード手法が見つかった-300x200.jpg)

のシンプルトレンドフォロー手法を確立させるまで-300x200.jpg)