のシンプルトレンドフォロー手法を確立させるまで.jpg)
This article is a trading strategy guide after a long break.
Today, I’m introducing an ultra-simple method using the moving average (MA), which is likely the most commonly used tool in chart analysis for stocks, forex, and other markets. (,,>᎑<,,)
Since this strategy uses only one moving average, it is easily replicable for beginners. I hope you find it helpful.
記事の目次
Why Establish a Trading Method Using the Moving Average Now
Do you have a trading method that uses moving averages?
In the past, I have analyzed and tested strategies using moving averages and written articles about them. However, in recent years, I mainly relied on the Wolfe Wave and RSI combination method, which has been sufficiently profitable.
The Wolfe Wave method has a win rate of about 70%, and the RSI alone also wins around 60-70% of the time.
When conditions for both methods are met, the win rate naturally increases, often exceeding 80%.
However, these strategies tend to involve counter-trend trading, and with the recent super-strong yen trend, there have been fewer trading opportunities as the trend itself has rarely broken.
Given the prolonged, one-directional trend, I realized that not having a robust trend-following method would result in significant missed opportunities. That’s why I decided to establish this method now. (;・∀・)
Trading Methods Using Moving Averages Tend to Be Complex and Lack Replicability
I’ve always felt that while many people introduce various strategies using moving averages, they often seem overly complicated.
These methods are often described as simple and straightforward, but when you look closely, they involve multiple moving averages, Bollinger Bands, or Ichimoku Cloud.
Entry timing explanations such as “when the price crosses the moving average” or “when it touches a certain standard deviation of the Bollinger Band” are common. But which timeframe should you use? Do you wait for the candlestick to close or not? It often feels like these methods aren’t practical for real trading.
Given the low replicability of these strategies, I decided it’s more reliable to discover and analyze my own method ( ;꒪⌓꒪;).
Trading Methods Using Moving Averages Tend to Be Complex and Lack Replicability
First, let’s perform an analysis based on the following rough trading rules derived from the chart to determine whether it’s worth conducting a historical backtest.
- Moving Average (SMA) Setting: 20
- Clearly sloping either upwards or downwards
- A candlestick moves in the opposite direction of the moving average slope
- Enter when a candlestick crosses the moving average again while the slope of the moving average is maintained
- Exit if a candlestick crosses in the opposite direction of the moving average slope again
Honestly, at this stage, the stop-loss rule is almost finalized, but the take-profit rule might still need adjustments.
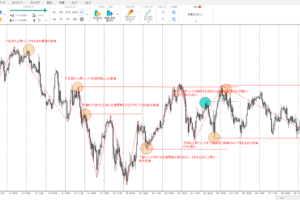
Here is an example of a chart that fits the above trading rules.

Analysis of the Chart Information
| Past chart analysis information | |
| Currency pair | USDJPY |
| Analysis period | January 2015 – December 2016 |
| Main axis time frame | 1 hour foot |
Analysis Results of the Simple Method Using a Single Moving Average
Let’s dive right in—here are the analysis results from the USD/JPY market over the past two years.
| Analysis results of moving average simple method | |
| Trade rule target count | 138 times |
| Number of winning trades | 122 times |
| Number of losing trades | 16 times |
| Winning rate | 88.4% |
Although this is still in the analysis phase and hasn’t been traded live yet, the findings are promising.
- Total Trades: Over 100
- Win Rate: 88.4%
This data set is substantial, and the win rate of 88.4% is impressively high ( -`ω-)✧ドヤッ
Honestly, these results are good enough to make me want to use this method for real trading.
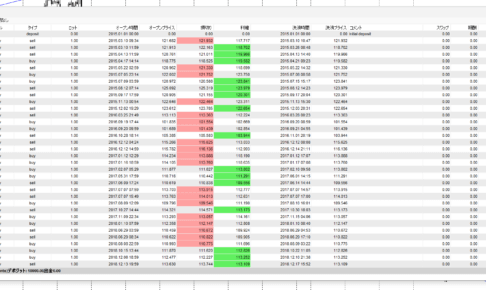
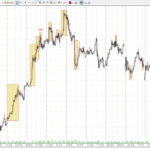
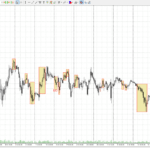
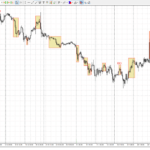
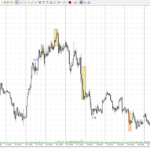
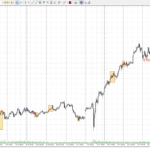
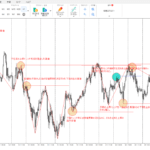
The analysis chart is a bit cluttered, but I’ve attached it for reference.
- Yellow Boxes: Winning trades
- Light Blue Boxes: Losing trades
The small numbers are for counting the trade occurrences, and the moving average isn’t displayed because the screenshot was taken from a 4-hour chart instead of a 1-hour chart to fit everything in. Please disregard this detail.
Not Just the Win Rate, but the Advantage of This Method Lies in Its Losing Trades
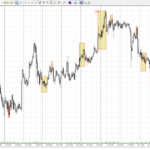
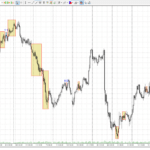
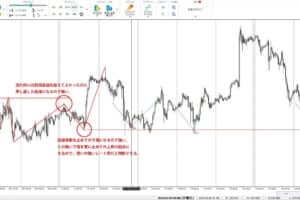
For instance, the next chart image zooms in on a losing trade, showing that the actual body of the bearish candlestick, which we assumed as the stop loss, is only 12 pips.
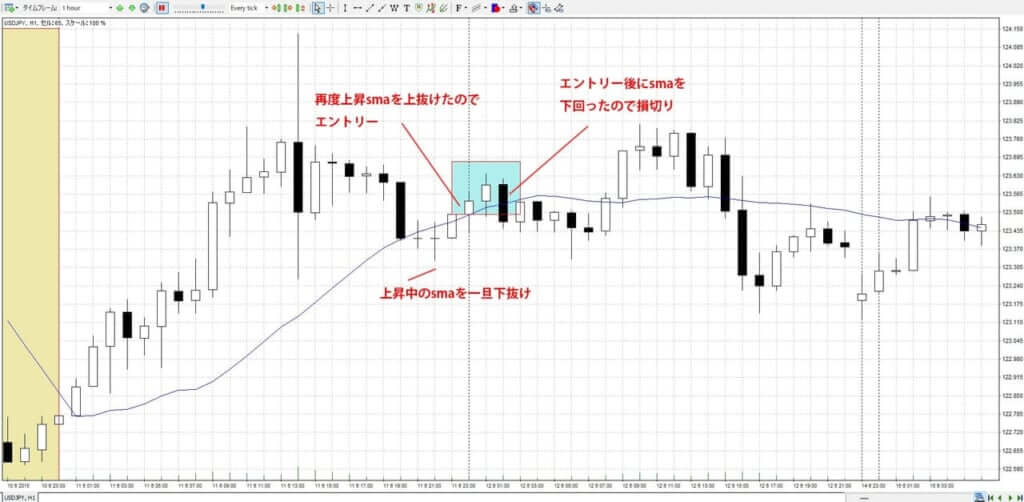
You’ll notice the same pattern with other losing trades—the price movement is significantly smaller compared to winning trades.
Considering the entry condition, this is quite logical. The entry condition is when the price crosses above the moving average, and the stop loss condition is when the price crosses back below the moving average. Logically, this makes it a trade method with a good risk-reward ratio.
Summary of the Simple Trend-Following Method Using a Single Moving Average
In this analysis of a trading method using a moving average, I concluded that no adjustments are necessary at this point, and it’s worth proceeding with further backtesting.
The small stop-loss range is a positive aspect of this method, but I would like to increase the profit margin a bit more. One possible adjustment could be changing the take-profit rule to “exit after the first confirmed bearish candlestick following the entry.”
The Logic Behind Using Moving Averages Aligns with Market Psychology
When an uptrend occurs, many traders want to join in and ride the wave. Naturally, they look for pullbacks to enter at a slightly lower price.
The market moves up and down, and no one can predict exactly when it will rise or fall. The moving average serves as a benchmark that reflects the most suitable price range for both conditions.
When the price is below a rising moving average, traders feel uneasy, and when it is too far above, they worry it might be overbought.
From a psychological perspective, the moving average represents the most stable price level.
Additionally, this method involves entering a trade when a candlestick crosses above the rising moving average from below. This ensures a stable entry price and increases the likelihood of the trend continuing upward.
Next: Backtesting with Forex Tester Using Historical Data
Given the high win rate during the analysis phase, I plan to proceed with backtesting without making any further changes to the trading rules.
Using Forex Tester for backtesting allows us to gather comprehensive statistical data such as pips gained, win rate, loss rate, loss pips, and various averages. This helps in finalizing the take-profit rules based on actual performance data (˶ᵔ ᵕ ᵔ˶).
No matter how good the win rate looks during analysis, real trading often doesn’t go exactly as planned. Therefore, the win rate might slightly decrease, and we might need to refine the trading rules further.
If you’re interested in the simple trend-following method using just one moving average introduced today, stay tuned for the next article.
23 Years of Actual Historical Data
Tick Data for Timeframes Below 1 Minute
Comprehensive Support System

の使い方を分析してみたら勝率56.7のトレード手法が見つかった-300x200.jpg)