It’s been quite a while since my last post, following the upgrade to ForexTester5, but Happy New Year(。˃ ᵕ ˂。)
The first article of 2024 has to be about a new trading strategy, right?( ー`дー´)キリッ
You can never know too many trading strategies, and if a strategy is highly replicable and boasts a good win rate, it’s beneficial for everyone.
Here are the features of this new trading strategy:
- Anyone, including beginners, can easily replicate it.
- Decisions are based on confirmed chart patterns and candlestick formations, not calculated values like indicators or oscillators.
- Identifying strong rate zones within the market allows for easy adjustment of the risk-reward (RR) ratio.
Let’s dive in!
記事の目次
The Strongest Rate Zones Are the Points That Changed the Market Trend
Let’s start with an example for clarity.
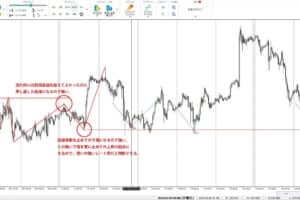
Chart Example Showing a Clearly Strong Buying Force
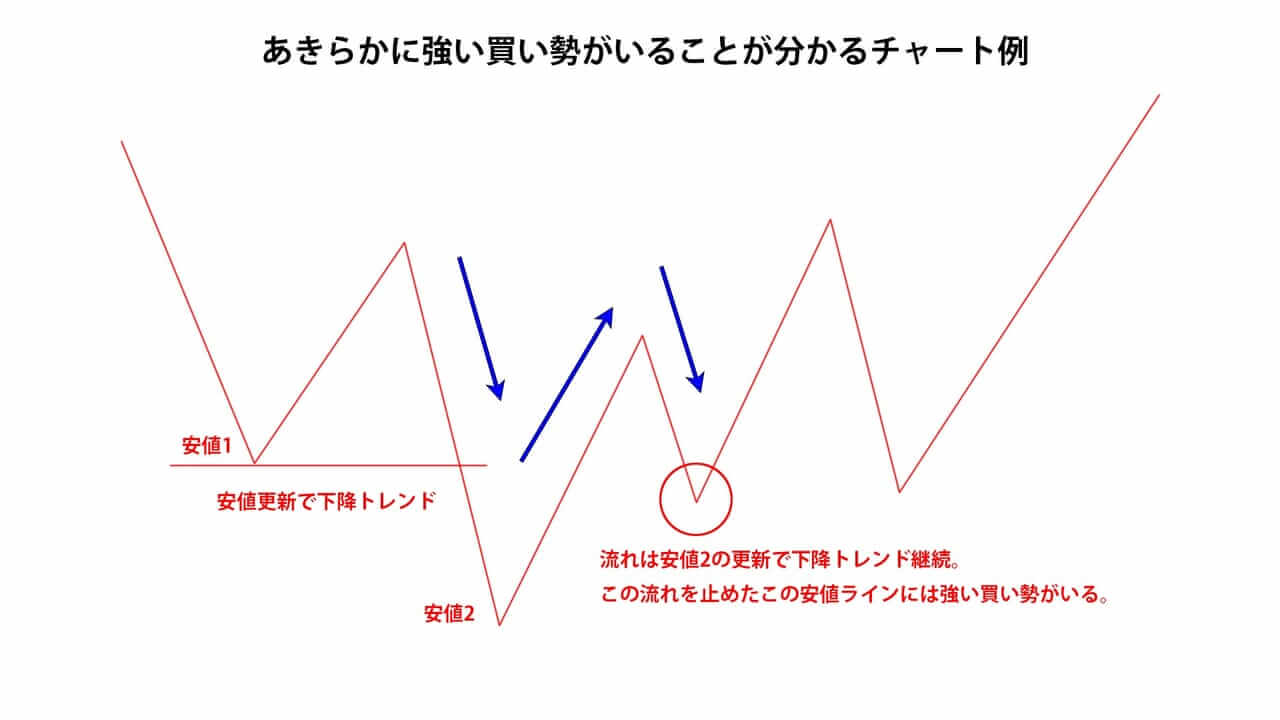
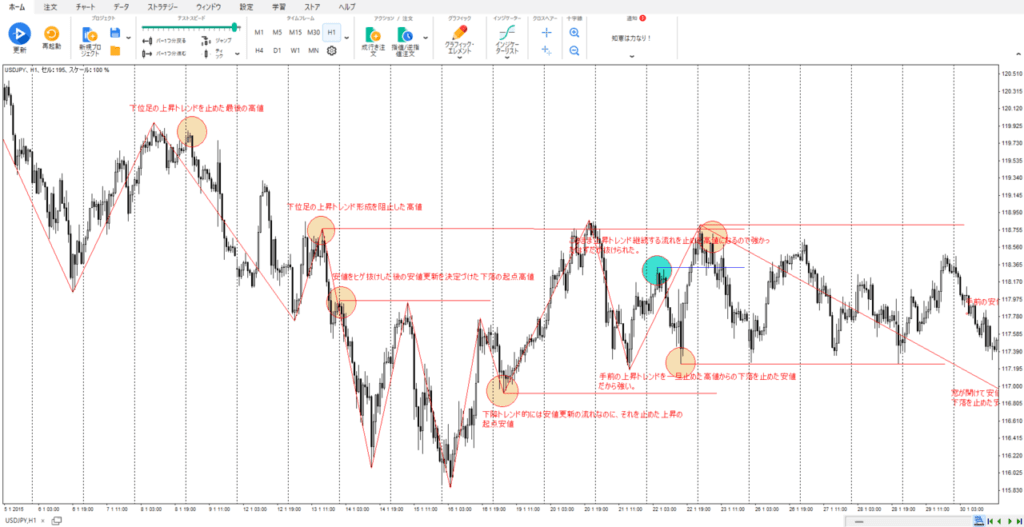
The red circled areas in the image are the points we aim for with this strategy.
As explained in the chart, the downward movement towards the red circle can be seen as an attempt to continue the downtrend by updating Low 2.
However, starting from the red circle, the previous downtrend ended.
This indicates that there is “something that ended the downtrend” at the red circle.
Whether this “something” is fundamental in nature or a large investor’s target is unknown, but frankly, it doesn’t matter.
All we need to know is “where the clearly strong rate zones in the market are.”
The key point is that the market, which anyone could see was in a downtrend, was “stopped.”
When the previous market trend is easy to identify, it means that many market participants are likely viewing it the same way. Therefore, the significance of stopping that trend becomes even greater.
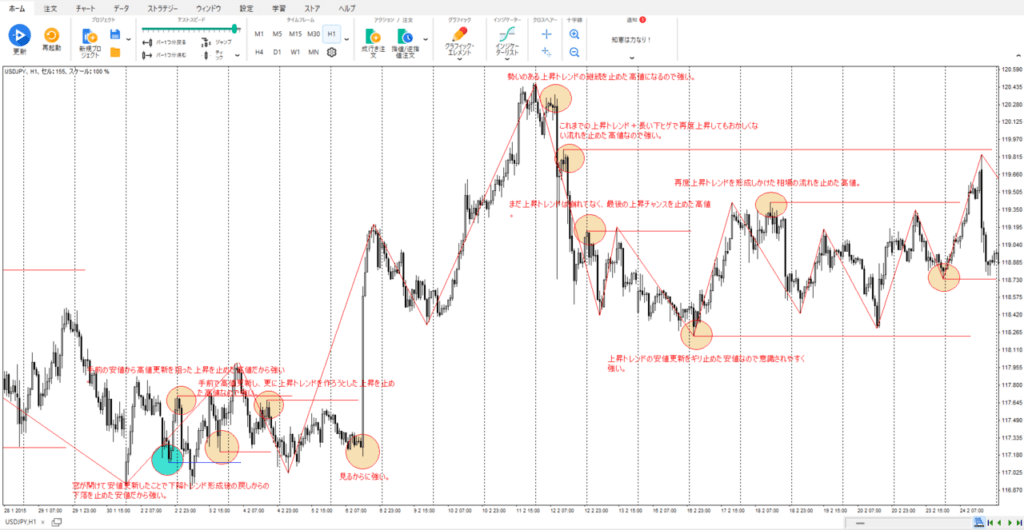
Chart Example Showing a Strong Rate Zone Based on Market Psychology
Here’s another example.
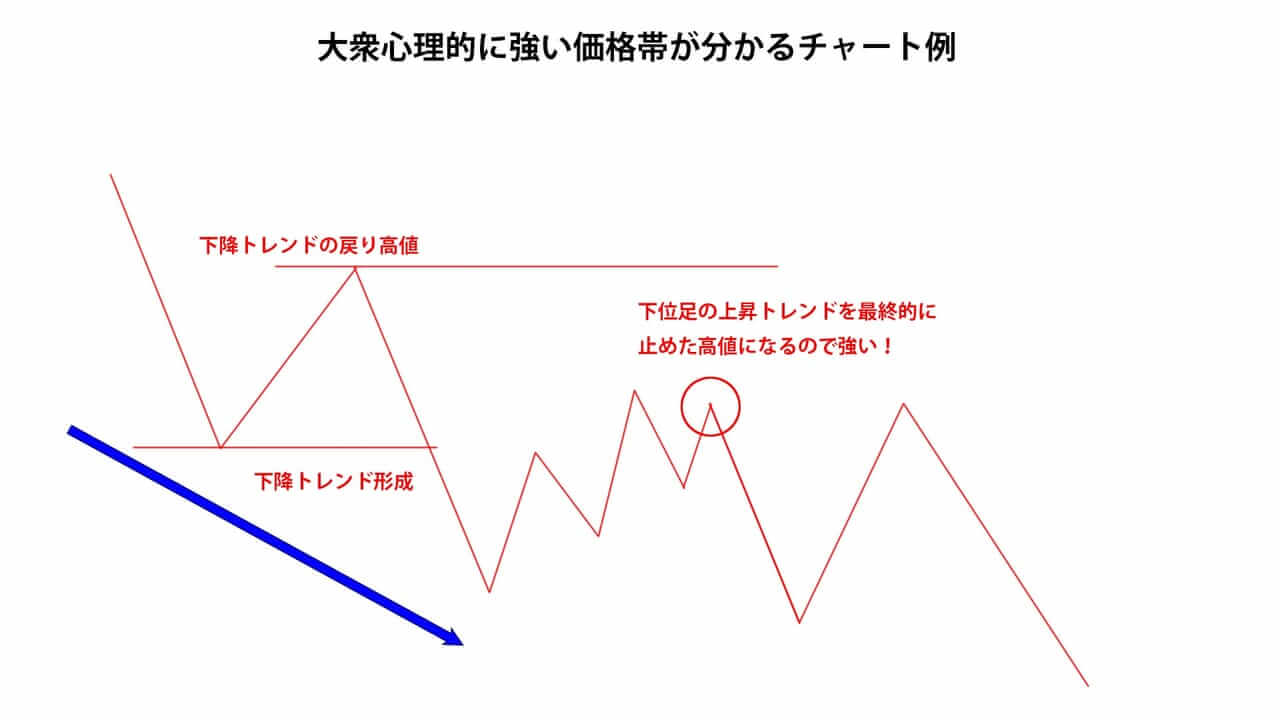
This time, it highlights a high that halted an upward trend in a lower timeframe, observed within the larger downtrend.
The high marked with a red circle stopped the clear upward trend in the lower timeframe and initiated the continuation of the downtrend in the higher timeframe. This indicates that strong selling forces entered the market at this point.
When the price returns to such a rate zone in an upward movement, it often experiences a reversal, which is the key target for this strategy.
Analyzing Reactions at Strong Rate Zones on Actual Charts
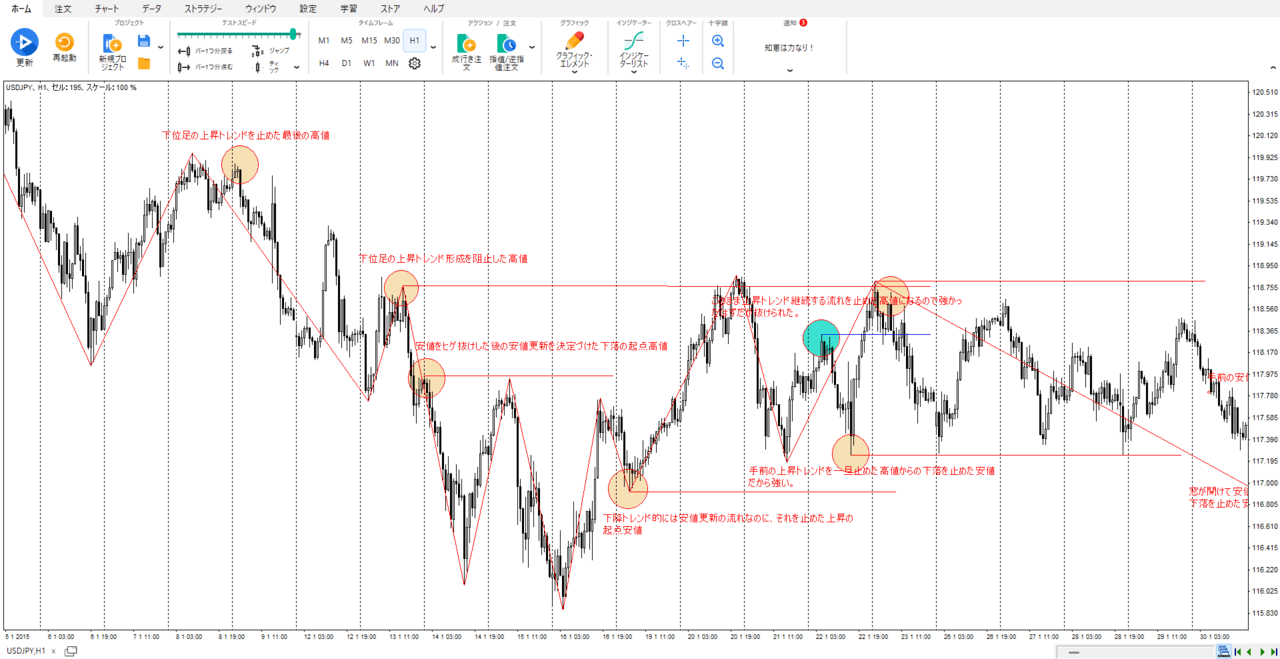
Now, let’s look at the price reactions at the rate zones identified through our previous market analysis on actual charts.
| Past chart analysis information | |
| passing pair | USDJPY |
| Analysis period | January 2015 – December 2015 |
| Main axis time frame | 1 hour foot |
Since I primarily day trade, I used the 1-hour chart as the main timeframe.
With a 1-hour chart, even a one-year analysis period provides ample trading opportunities, which is convenient (^-^)/.
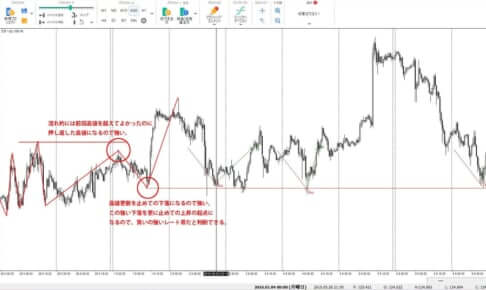
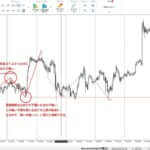
Here are some excerpts from the analysis charts to illustrate this.
The circles indicate the areas identified through analysis as strong rate zones. Yellow circles mark where the market either rebounded or didn’t reach the zone, remaining untested.
Blue circles indicate areas where the price did not rebound and broke through the zone.
Red lines are drawn for clarity to show the rebounds, and the accompanying text explains why these areas are considered strong rate zones. If you’re interested, please read the text for detailed explanations.
Although this isn’t the entire analysis period, here are the results based on the charts provided.
| Total number of strong rate bands | 18 times |
| Return not confirmed | 3 times |
| Recovery at a strong rate band | 13 times |
| Strong rate band not recovered | 2 times |
What Do You Think?
Even for day traders, the frequency is more than satisfactory, with a market reaction rate of 70%, excluding untested zones.
This win rate is quite high for a trading strategy.
However, at this stage, we only have the entry conditions for the trading strategy. We still need to determine the stop-loss and take-profit targets.(=^_^=)
Setting Stop-Loss and Take-Profit Levels for the Strong Rate Zone Trading Strategy
To enable future backtesting, let’s finalize the rules for determining stop-loss and take-profit levels for this trading strategy.
I’ve applied these rules to the previous chart image for clarity.
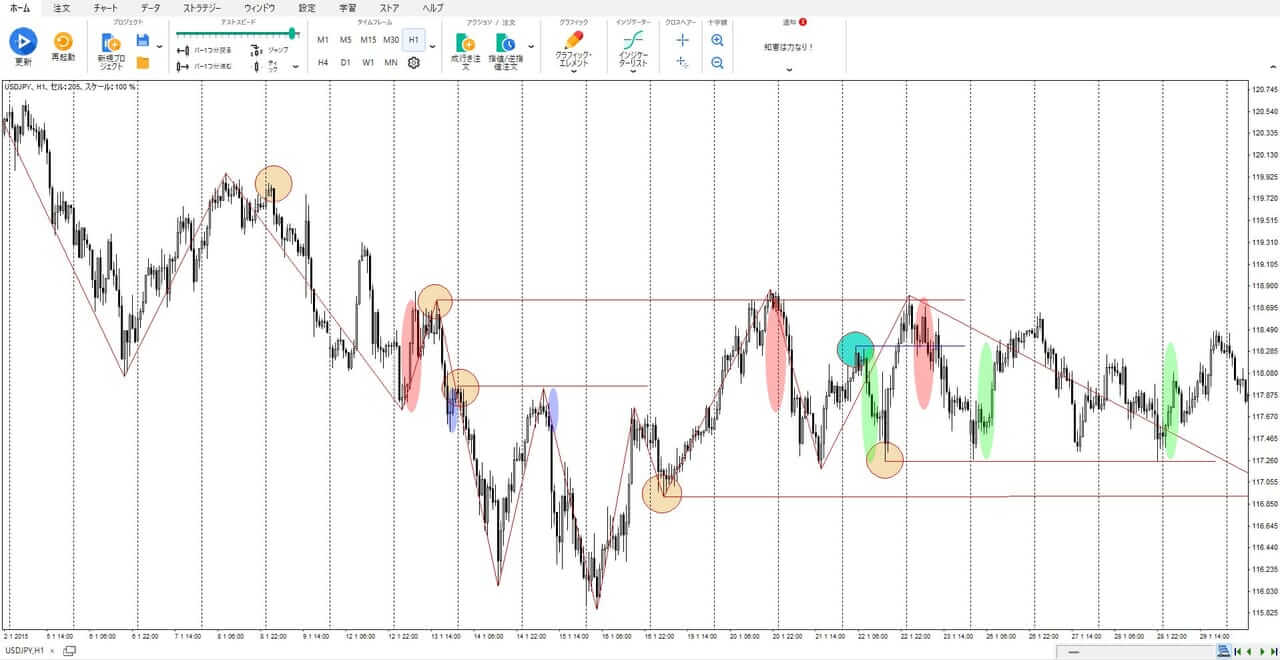
The stop-loss should be set a few pips above or below the strong rate zone.
Personally, I think 10-20 pips should be sufficient.
The take-profit target should be the price range from the recent high or low to the identified strong rate zone.
Although further backtesting might allow us to add more specific rules, this should suffice for now.
In the reference chart image above, the areas enclosed by light pink, light purple, and light green circles represent the take-profit targets.
If setting the take-profit target as per the rules results in a small profit margin, as seen with the light purple example, you might consider skipping the trade from a risk-reward perspective.
Summary of the Strong Rate Zone Targeting Method Analysis
While writing this article, I’ve been thinking about what to name this strategy, and I finally came up with a good one. From now on, I’ll refer to the strategy explained in this article as the “Strong Rate Zone Targeting Method” σ(*´∀`照).
Although the chart patterns might resemble modified double tops/bottoms or head and shoulders, the difference lies in the entry conditions. If you’re already using double tops/bottoms or head and shoulders in your strategy, you might first trade based on the neckline of those patterns and then re-enter trades at the strong rate zones identified here.
Having multiple well-tested and proven strategies is always beneficial.
Now, let’s wrap up by summarizing the trading conditions for the Strong Rate Zone Targeting Method.
- Target the high and low prices that have previously stopped or changed the market flow.
- Focus on markets where the trend direction and respective highs and lows are easily identifiable by anyone.
- Enter the trade when the price returns to the rate zone identified as strong.
- Set the stop-loss 10-20 pips from the entry rate zone.
- The take-profit target is the price range from the recent high or low to the identified strong rate zone.
- Skip the trade if the risk-reward ratio calculated from the take-profit target is less than 1:1.
How Does That Sound?
Next time, I will use ForexTester to backtest the “Strong Rate Zone Targeting Method” and summarize the results in an article, so stay tuned (ゝω・).
I’ve also written a separate article on ForexTester, covering everything from how to download it to how to use it for free monthly. Please give it a read.
I have written an article summarizing the backtesting results of the “Strong Rate Zone Targeting Method.”
のシンプルトレンドフォロー手法を確立させるまで-150x150.jpg)
の使い方を分析してみたら勝率56.7のトレード手法が見つかった-300x200.jpg)

のシンプルトレンドフォロー手法を確立させるまで-300x200.jpg)