In the previous analysis, I reviewed a trading strategy using moving averages, which are said to be the most widely used indicator globally.
By analyzing the past month and a half of data, I was able to narrow down the strategy to a set of rules that could potentially yield a win rate of around 56.7%.
- Analyze the 1-hour moving average (SMA).
- The moving average line setting value is 20.
- A touch is considered to be within ±10 pips above or below 20sma.
- A rebound is determined when the price moves by +50 pips or more in the rebound direction.
- 20sma is facing either up or down, rather than horizontally.
I’ve summarized the analysis process and details in a separate article, so feel free to check that out for reference.
の使い方を分析してみたら勝率56.7のトレード手法が見つかった-486x290.jpg)
Up to this point, I’ve only identified the market environment and trading strategy, but I haven’t yet determined the specific entry criteria or entry points for live trades.
So, from here, I will establish the entry rules that should be applied when the above trading strategy conditions are met.
記事の目次
- 1 Setting Entry Rules for Rebounds from the Moving Average
- 2 Analyzing the Entry Rules for the Rebound on December 16, 2020, at 19:00
- 3 Analyzing the Entry Rules for the Rebound on December 16, 2020, at 6:00
- 4 Analyzing the Entry Rules for the Rebound on December 11, 2020, at 6:00
- 5 Analyzing the Entry Rules for the Rebound on November 30, 2020, at 23:00
- 6 Summary of the Entry Rules for Rebounds Using the Moving Average with a 56.7% Win Rate
Setting Entry Rules for Rebounds from the Moving Average
The trading strategy is based on rebounds from the 20-period simple moving average (SMA) on the 1-hour chart, but the entry rules will be determined by analyzing shorter timeframes.
Actual entries will also be executed on these shorter timeframes.
There are several short timeframes to choose from—such as the 1-minute, 5-minute, 15-minute, and 30-minute charts—but since the strategy is based on the 1-hour chart, I will focus on the 5-minute chart for entry rules this time.
Preparing to Identify the Entry Rules
Before analyzing a few points where a rebound from the 20SMA on the 1-hour chart was confirmed, let’s first set up some preparations.
I’ll be looking at the 5-minute chart, but I also want to know the 20SMA price from the 1-hour chart at the same time, so I’ll configure the chart to display the 20SMA from the 1-hour chart on the 5-minute chart.
To display the 1-hour 20SMA on the 5-minute chart, you can calculate it using the following formula.
| The number of 1-hour bars broken down into 5-minute bars is 20. | (60 minutes / 5 minutes) * 20 = 240 pieces |
However, keep in mind that the moving average indicator is calculated based on the “average of the specified number of closing prices for the timeframe being displayed,” so while the calculation is correct, the 20SMA on the 1-hour chart and the 240SMA on the 5-minute chart won’t be exactly the same.
Now, let’s begin by reviewing the 5-minute charts at each rebound point. The moving averages displayed on the chart will be as follows:
| red moving average line | 1-hour 20sma displayed on 5-minute chart |
| blue moving average line | 5 minute 20sma |
Analyzing the Entry Rules for the Rebound on December 16, 2020, at 19:00
Let’s look at the 5-minute chart around 19:00 on December 16, 2020, where a rebound was confirmed on the 1-hour chart.
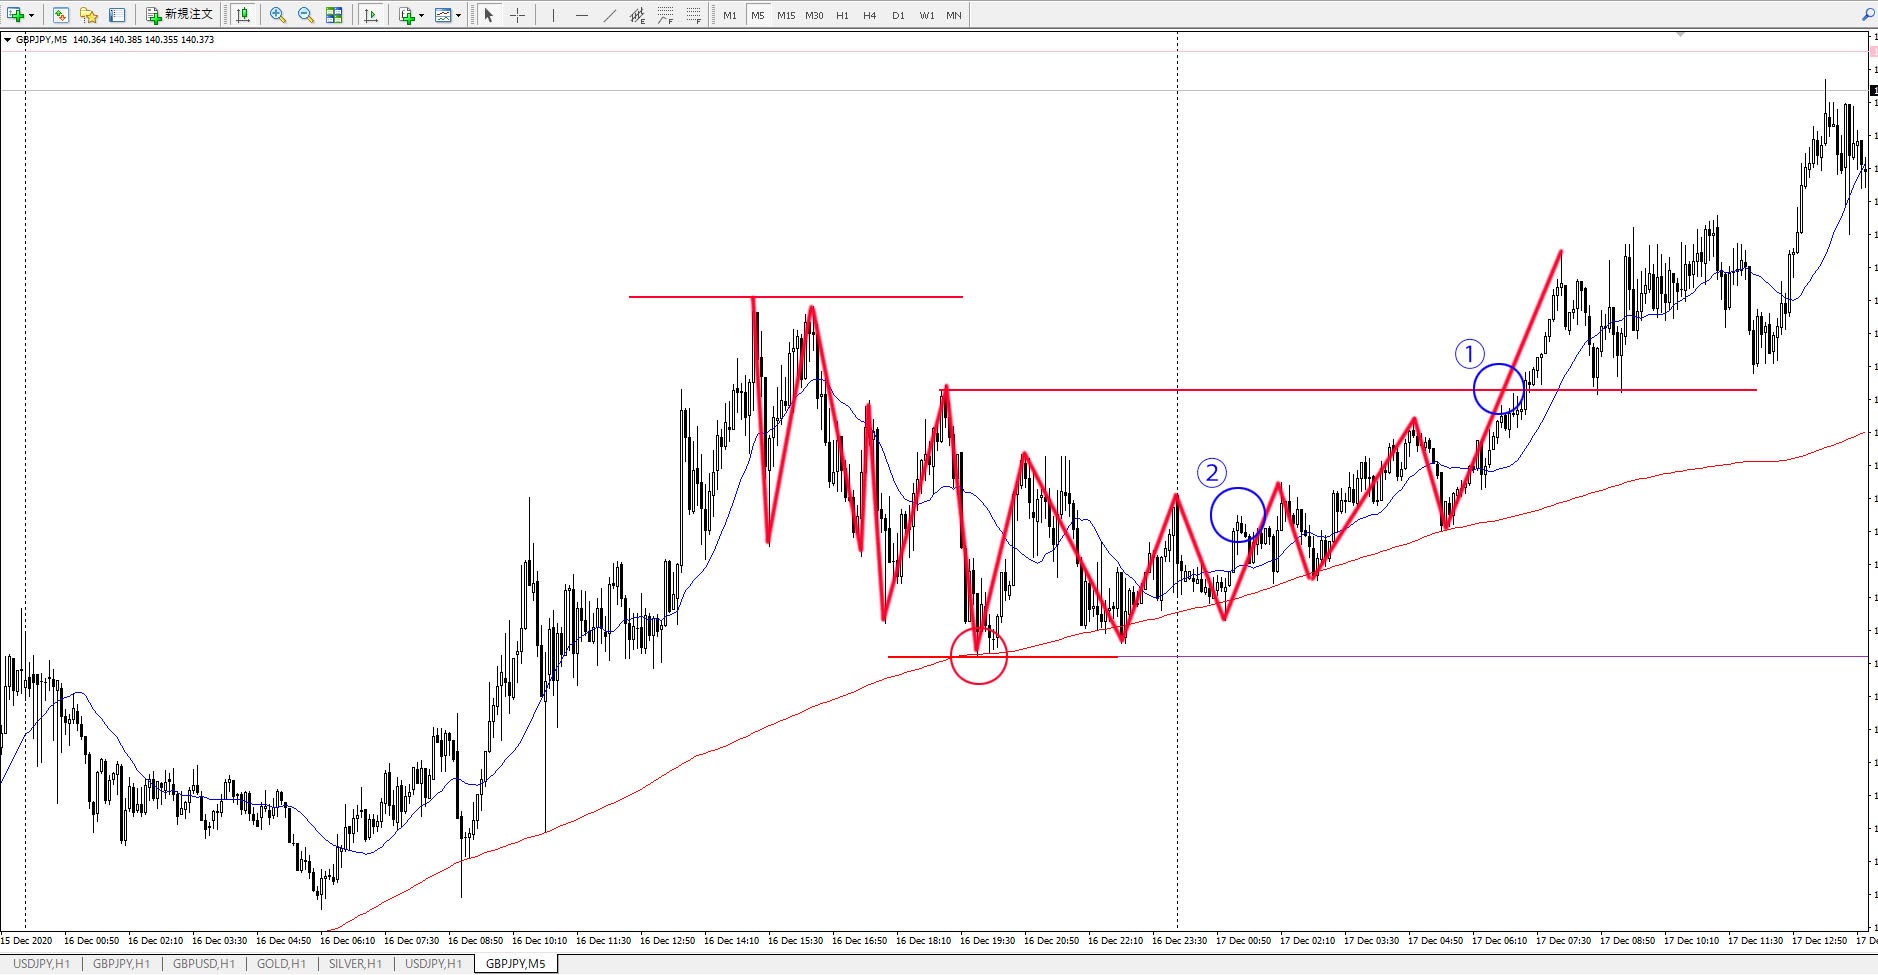
Even on the 5-minute chart, you can see a clear uptrend. However, on a shorter time frame, the price wasn’t able to break above the previous high (shown by the left-side high line) and shifted to a downward trend, eventually dropping to the price marked by the red circle.
After the price in the red circle touched the 20SMA (1-hour), it continued to follow the 20SMA (1-hour) and eventually shifted back to an upward trend.
From this 5-minute chart, I’ll now define the entry rules.
Entry Point 1
The most advantageous point seems to be at the blue circle (①).
After hitting a low at the red circle and failing to break that low, the price formed a higher low and broke above the previous high, indicating upward movement. According to Dow Theory, the trend direction only shifts once the price exceeds the high of the retracement (near the red circle low).
- The timing when the line of sight changes from lowering to raising the direction you are aiming again in 5 minutes.
- The 20sma (5 minute chart) is trending upward.
- The stop loss point is 45-50 pips at the low price of the red circle.
Entry Point 2
While this point doesn’t fully align with Dow Theory, it still seems like a valid entry with some merit.
The line at Entry Point 1 marks the retracement high of the recent low, but with a 40-pip gap here, I’d prefer to enter a bit earlier if possible.
That’s where the blue circle (②) comes in.
After the red circle low, the price formed two higher lows while following the 20SMA (1-hour). Around the time the 20SMA on the 5-minute chart shifted from downward to upward, the price broke above the 20SMA (5-minute), presenting another potential entry opportunity.
- The 20sma (1 hour time frame) has been conscious and the price has lowered twice.
- The 20sma (5 minute chart) is completely pointing upwards.
- The price has exceeded the 20sma (5 minutes).
- The stop loss point is 20 to 30 pips at the low price of the red circle.
Analyzing the Entry Rules for the Rebound on December 16, 2020, at 6:00
Let’s take a look at the 5-minute chart around 6:00 on December 16, 2020, where a rebound was confirmed on the 1-hour chart.
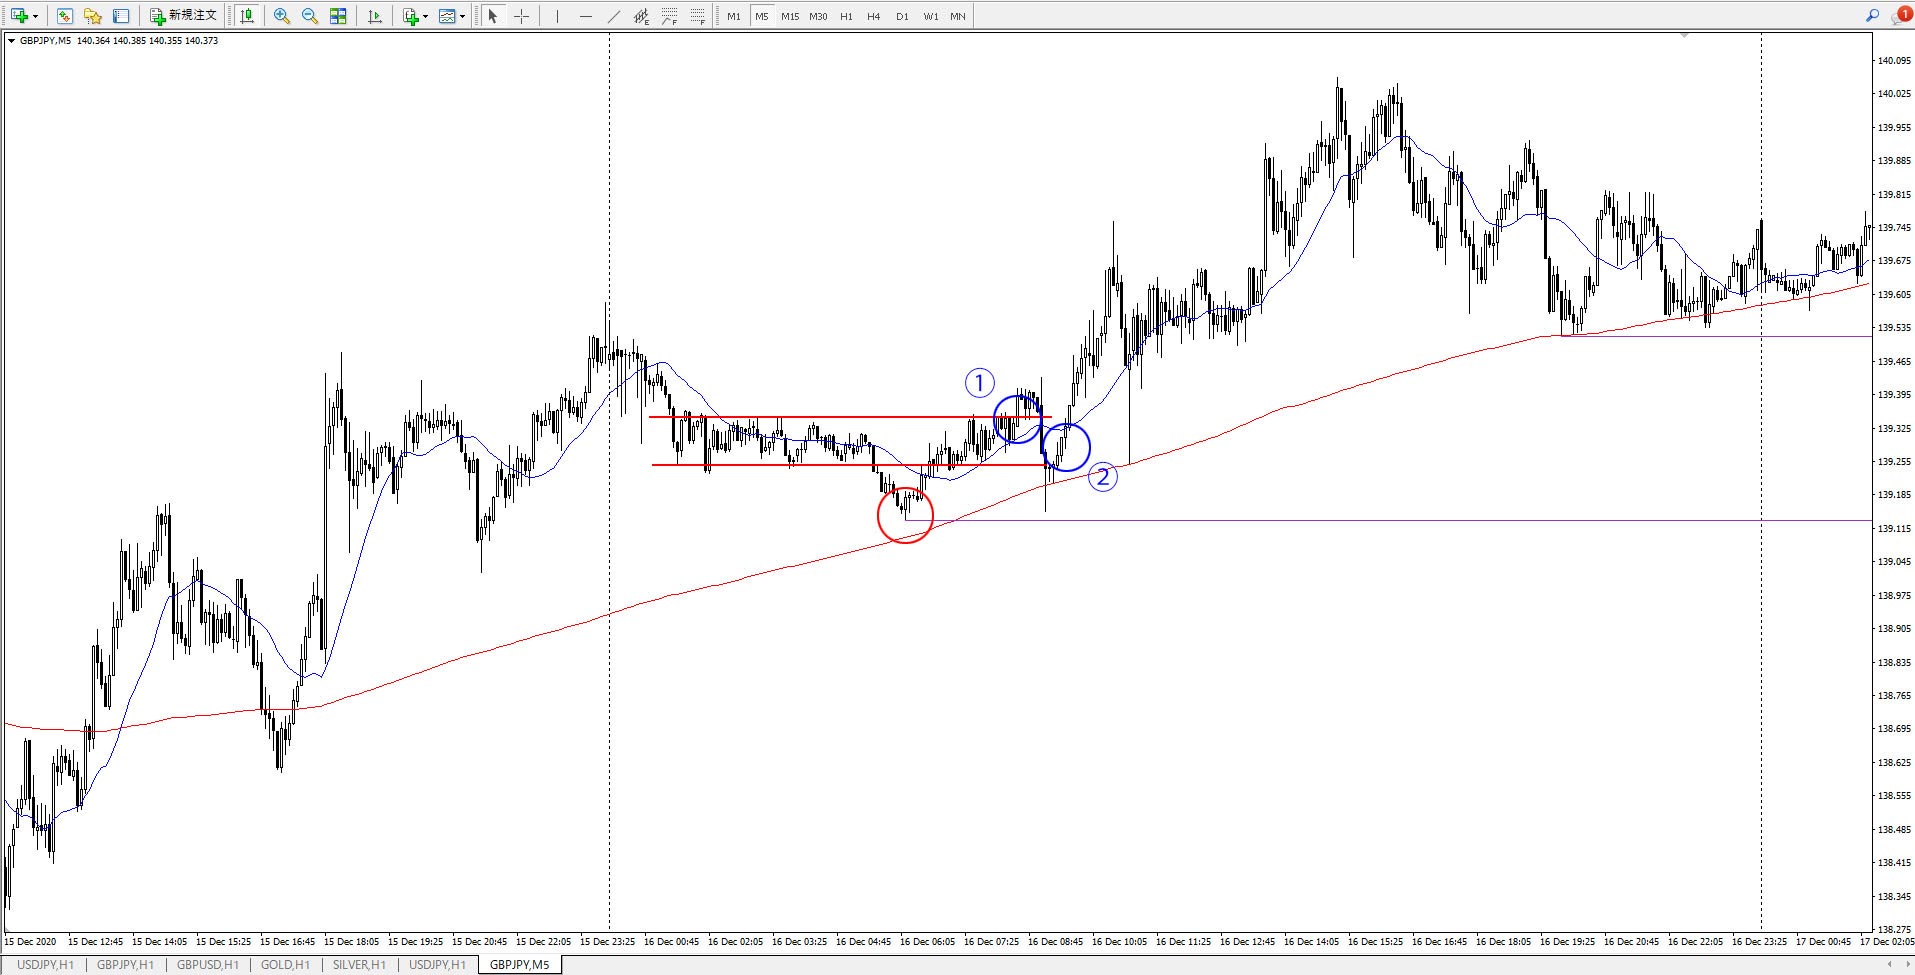
During this time, the 5-minute chart formed a light range before breaking below it. The 20SMA (1-hour) came into play, causing the price to return to the original range and break above it again.
Entry Point 1
The first potential entry point would be at the blue circle (①).
This chart is quite educational and interesting, so I’ll explain. When analyzing, it’s easy to look at a completed chart and assume, for example, that aiming for the blue circle (②) would be ideal.
This is the tricky part of analysis—because it’s done after the fact, you can always come up with reasons that seem valid, but it’s crucial to establish clear rules while imagining the price movement as it’s happening in real time, as I’ve done here.
Otherwise, when you later try to backtest on live charts, the strategy won’t be reproducible.
In my case, if I were watching the price move in real time, I would likely enter at the blue circle (①), which is why I made this the rule.
- The timing of the price breaking below the range, but rebounding at the 20sma (1 hour), and then breaking above the range.
- The stop loss point will be the lowest price of the red circle, so 25 to 30 pips.
Since the overall market analysis on the 1-hour chart has a bullish bias, I would wait during the downward break and enter the trade on the upward breakout.
Entry Point 2
The blue circle (②), as mentioned in the explanation for Entry Point 1, is easier to identify after the fact, which makes it a tricky spot. Since the breakout at blue circle (①) is only about 5 pips, it’s possible that in a live trade, I wouldn’t have been able to enter at that point.
In that case, blue circle (②) becomes the potential entry.
However, even for this, it’s important to have a clear rule, so the entry rule for this situation is as follows:
- Attach a pin bar at 20sma (1 hour) and bounce back.
- After that, the timing when the positive line was confirmed by exceeding the high price of the pin bar.
- The stop loss point will be the lowest price of the red circle, so it will be 17 to 25 pips.
Analyzing the Entry Rules for the Rebound on December 11, 2020, at 6:00
Let’s take a look at the 5-minute chart around 6:00 on December 11, 2020, where a rebound was confirmed on the 1-hour chart.
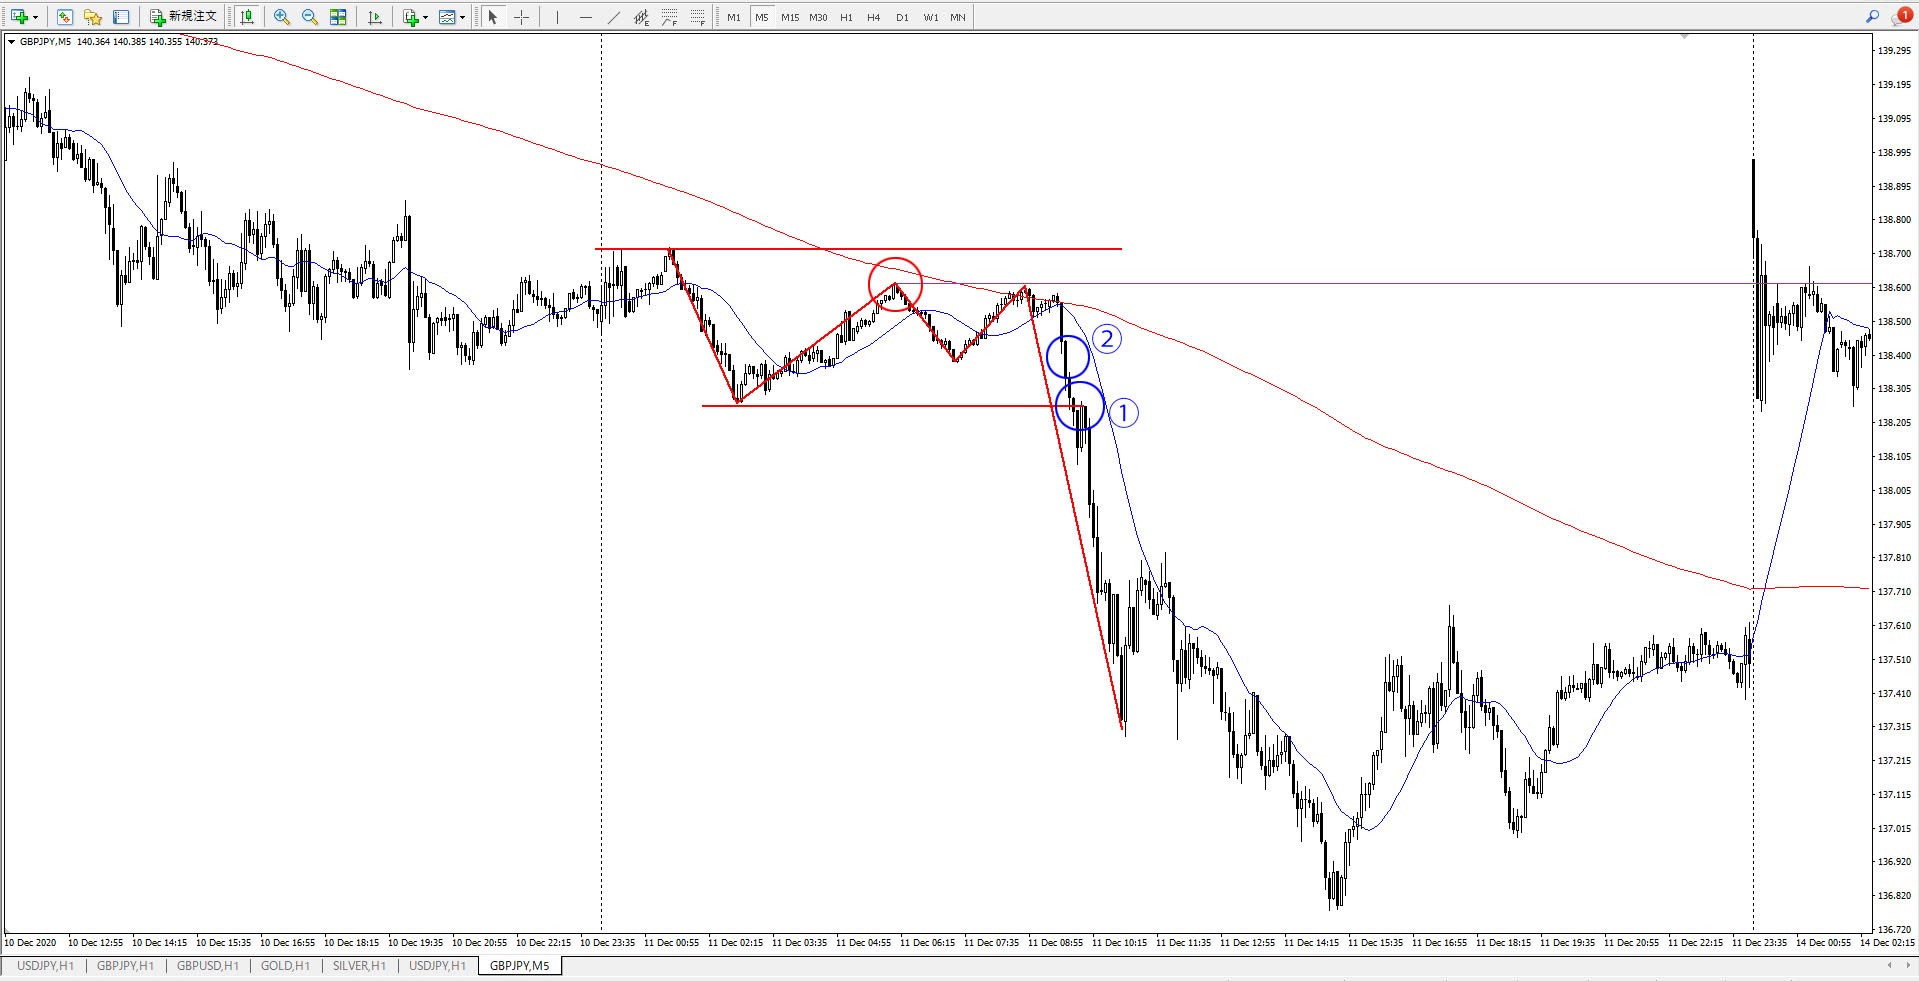
In this case, the market analysis on the 1-hour chart indicated a bearish bias.
After dropping from the high line to the low line, the price touched the 1-hour 20SMA around the red circle and declined again, but it couldn’t break the previous low. The price rose again but failed to break above the 1-hour 20SMA and the high at the red circle. The price then sharply broke through the low line, confirming a continuation of the downtrend.
Entry Point 1
The most advantageous entry point in this case would be at the blue circle (①).
As explained above, the downtrend continuation can be confirmed when the price drops below blue circle (①).
- After the 20 sma (1 hour time frame) was noticed twice and failed to update the high price, the timing of the trend continuation with the new low price.
- The stop loss point will be the high price of the red circle, so 35 to 40 pips.
Entry Point 2
This entry would be a bit riskier and is more of a “greedy mode” scenario, where Dow Theory is somewhat ignored.
- The timing when the 20 SMA (1 hour time frame) was noticed twice and failed to update the high price, and updated the latest low price with more force than before.
- The stop loss point is at the high price of the red circle, so it is 25-30 pips.
Analyzing the Entry Rules for the Rebound on November 30, 2020, at 23:00
Let’s take a look at the 5-minute chart around 23:00 on November 30, 2020, where a rebound was confirmed on the 1-hour chart.
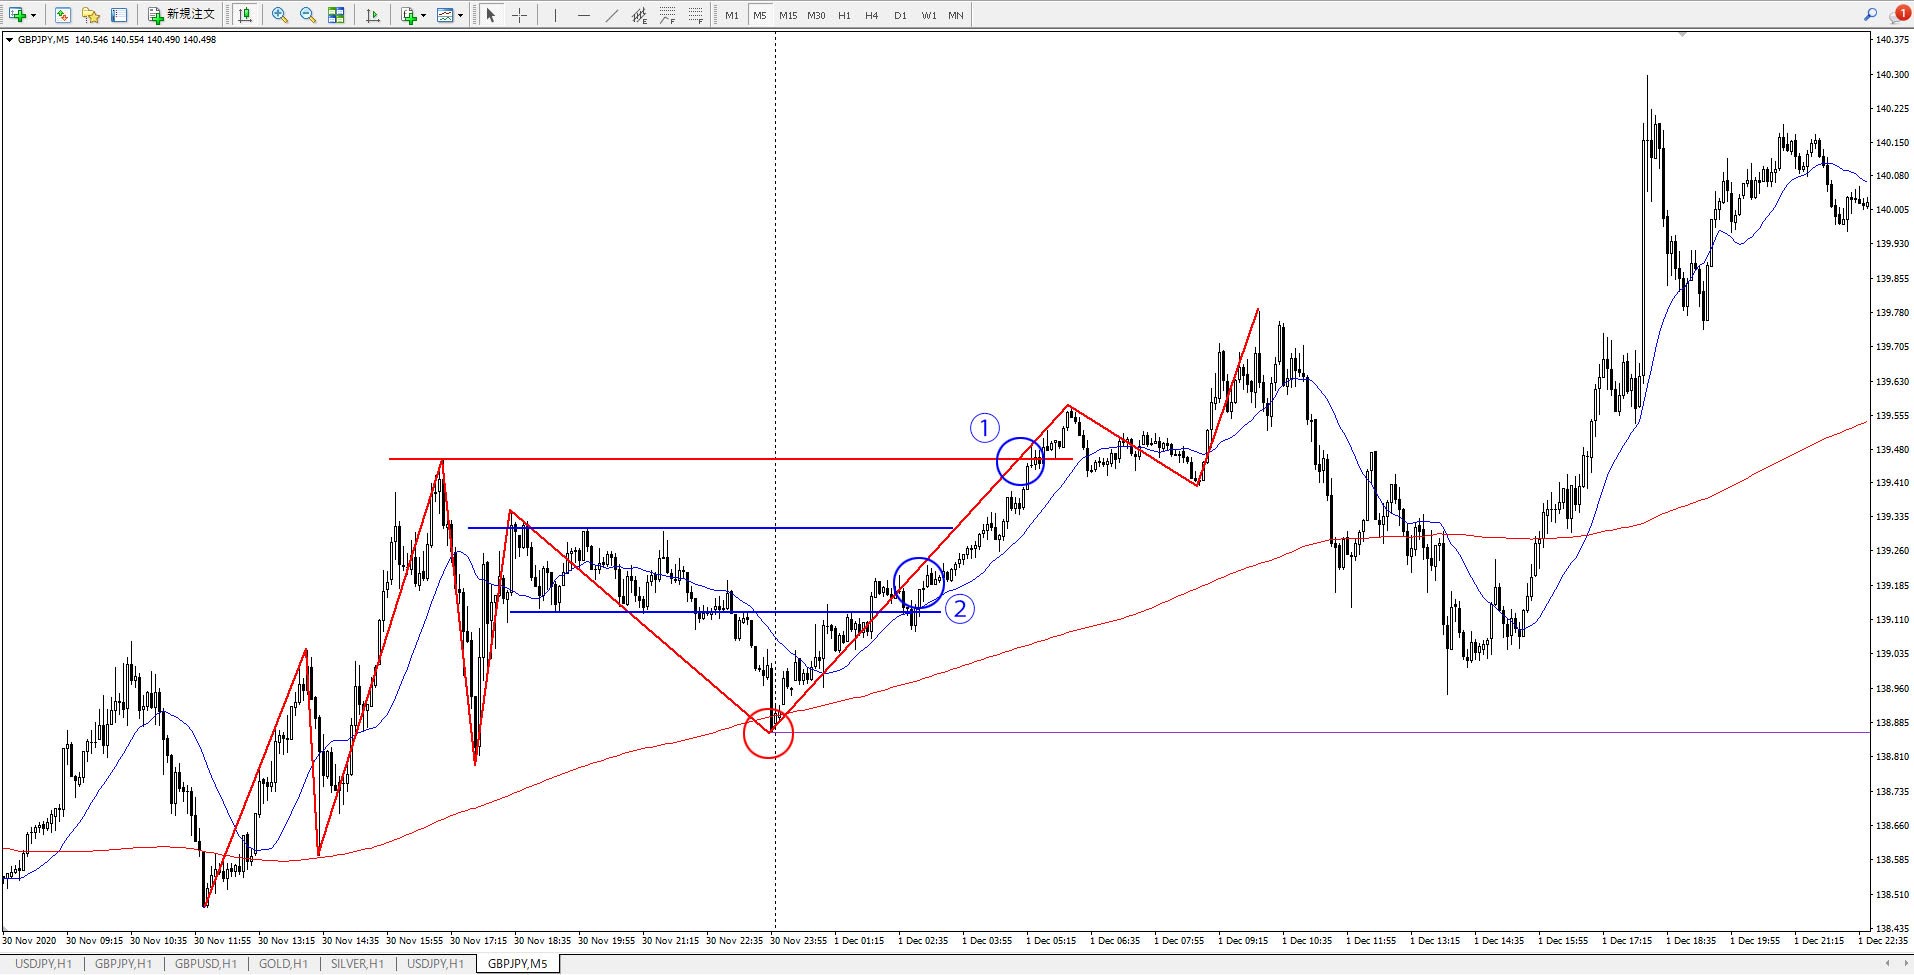
The price action on this chart is a bit irregular, but after making a sharp move up to a new high (red line), it then dropped.
After that, the price moved in a range-like pattern (blue line) before breaking below, rebounding off the 1-hour 20SMA, and then continuing upward to break both the range high and the previous high (red line), confirming the continuation of the uptrend.
Now, let’s determine the entry points.
Entry Point 1
In this case, the most advantageous and standard entry point would likely be at blue circle (①), where the price broke above the previous high. Therefore, the entry rule would be as follows.
- The timing when the Dow theoretically exceeds the previous high and continues the trend.
- The loss cut will be at the latest low price (red circle), so 60-65 pips.
Entry Point 2
However, if you look at the stop-loss range for Entry Point 1, you’ll notice that there are quite a few pips between the previous low and the entry, which feels a bit excessive.
That’s why, in a more aggressive (or “greedy mode”) approach, blue circle (②) could also be considered.
The low formed after the previous high (red line) was not broken when the price rebounded off the 1-hour 20SMA.
With the momentum from this rebound, the price re-entered the range and also bounced off the 5-minute 20SMA.
Given this flow, an entry at the moment the price breaks the range high line would be a valid Entry Point 2, but personally, I would prefer to enter following the rebound off the 5-minute 20SMA.
Now, let’s summarize the rules.
- A rebound was confirmed at the 20sma (1 hour).
- After entering the range again, it rebounded even at the 20sma (5 minute chart).
- The direction of the 20 SMA (5 minute chart) is completely in the upward direction.
- The loss cut will be at the latest low price (red circle), so 30 to 35 pips.
Summary of the Entry Rules for Rebounds Using the Moving Average with a 56.7% Win Rate
In this article, I’ve analyzed price movements on four different 5-minute charts, but I’ve actually continued the analysis up to October 30, 2020, where rebounds from the 1-hour 20SMA were confirmed. Based on these results, I’ll introduce the entry rules I’ve established.
- Advantageous timing based on the Dow theory seen on a 5-minute chart.
- The direction of the 5-minute 20sma is firmly in the direction you are aiming for.
- The price has broken out in the desired direction from the 5-minute 20 SMA and is confirmed.
- The stop loss points are the most recent high and low prices of the Dow Theory on a 5-minute chart.
The rules above cover entry decision-making, timing, and stop-loss points. However, when it comes to determining the take-profit (exit) points during backtesting or actual trades, they will depend on the price highs or lows that seem achievable from the entry price. Therefore, there aren’t any specific take-profit rules included here.
That said, the rebound rule that led to narrowing down to a 56.7% win rate already includes the condition that “the price moved at least +50 pips in the direction of the rebound after the entry.” With this in mind, I plan to set the risk-reward ratio at a minimum of 1:1.5.
On the other hand, even if all the entry rules are met, if the expected price movement doesn’t suggest a 1:1.5 risk-reward ratio, I won’t enter the trade.
This concludes the summary of the entry rules for the 56.7% win rate rebound strategy using moving averages. However, remember that this is purely based on analysis of historical charts that have already played out!
Next, it will be necessary to backtest this trading strategy using real past data to discover further important trade setups and confirmations.
The key trade confirmations to look for are as follows:
- Is it possible to achieve the winning percentage shown in the analysis so far even with a trade that is actually moving?
- Is there a way to add more reproducible rules or determine payment points?
- About realistic risk-reward that can continue to generate profits.
I plan to summarize the results of this testing in a separate article, so feel free to check it out for reference when it’s ready.


の使い方を分析してみたら勝率56.7のトレード手法が見つかった-150x150.jpg)
の使い方を分析してみたら勝率56.7のトレード手法が見つかった-300x200.jpg)

のシンプルトレンドフォロー手法を確立させるまで-300x200.jpg)