Previously, the trading strategy had a win rate of 56.7% based on analysis, but after actually backtesting it, the results were dismal.

However, after analyzing the losing trades from the backtest and revising the trading rules, I re-tested the strategy, which now has improved accuracy. I would like to share the summary of that backtest.
記事の目次
- 1 The Trading Strategy Used for This Backtest
- 2 Results of the Second Backtest Using the Trading Strategy with a 56.7% Win Rate
- 3 Aiming for Further Win Rate Improvement by Revisiting Losing Trades
- 4 Candle Wicks Hold Special Meaning in Price Action
- 5 Summary of the Moving Average Rebound Trading Strategy with a 61% Win Rate from Backtesting
- 6 Final Summary of the 20 SMA Rebound Trading Strategy
The Trading Strategy Used for This Backtest
- Rebounds off the 1-hour chart’s moving average (SMA).
- The moving average is set to 20.
- A touch is defined as within ±10 pips of the 20 SMA.
- A rebound is considered when the price moves more than +50 pips in the rebound direction.
- The 20 SMA should be sloping, not flat.
- There should be no price range (line) likely to act as resistance in the direction you’re targeting.
- Entries are made on the 5-minute chart.
- The entry is based on Dow Theory, ensuring the timing has a statistical edge.
- The direction of the 5-minute 20 SMA must be clearly aligned with the intended trade direction.
- The price must have broken and confirmed above the 5-minute 20 SMA in the intended direction.
- Stop-loss points are based on the most recent highs or lows according to Dow Theory on the 5-minute chart.
- The risk-to-reward ratio should be at least 1:1.5 or better.
Results of the Second Backtest Using the Trading Strategy with a 56.7% Win Rate
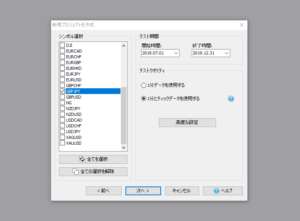
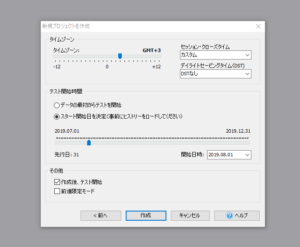
The currency pairs and periods tested are as follows.
| Currency pair | GBPJPY |
| Historical data period | July 1, 2019 – December 31, 2019 |
| Verification start period | August 1, 2019 – December 31, 2019 |
And the results of the first test are as follows:
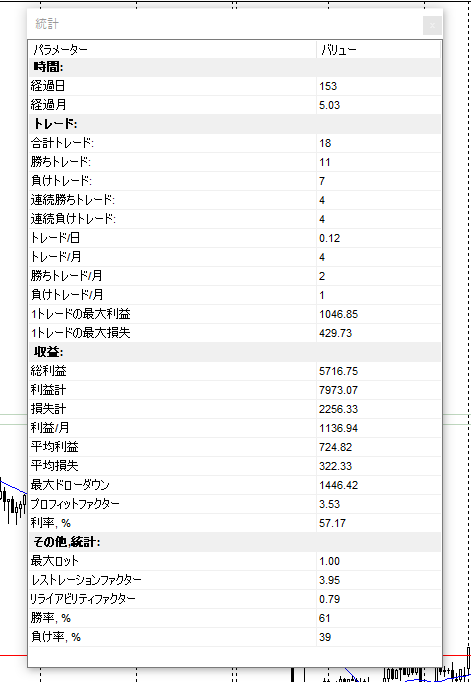
| Number of trades | 18 times |
| Winning trade | 11times |
| Losing trade | 7times |
| Winning rate | 61% |
| Net profit | $5716.75 |
Aiming for Further Win Rate Improvement by Revisiting Losing Trades
At this point, the trading strategy has become profitable enough to steadily increase gains. However, there are still areas where the rules could be made more precise and aspects that fit the rules but require extra caution. Therefore, I’d like to revisit the losing trades for further analysis.
Analysis of the Losing Trade on August 2, 2019, at 20:00
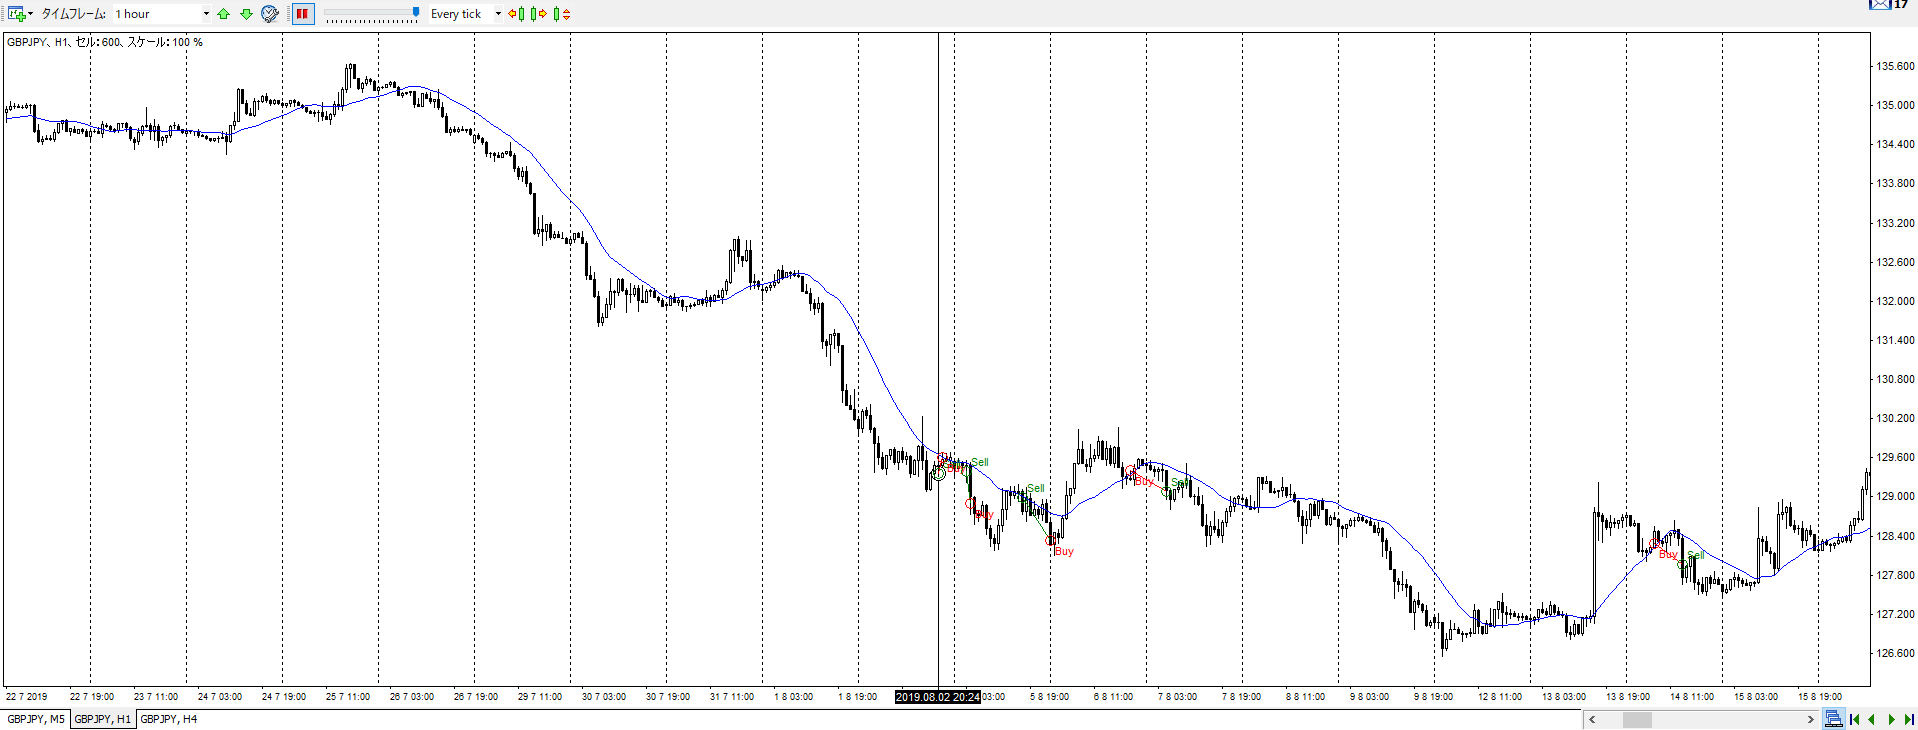
This is the 1-hour chart of the first losing trade.
It touched the 20 SMA and is clearly trending downward, so it follows the trading rules. However, since it’s a bit unclear, let’s take a look at the 5-minute chart.
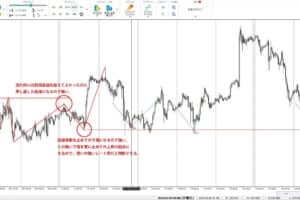
Here is the 5-minute chart of the same losing trade.
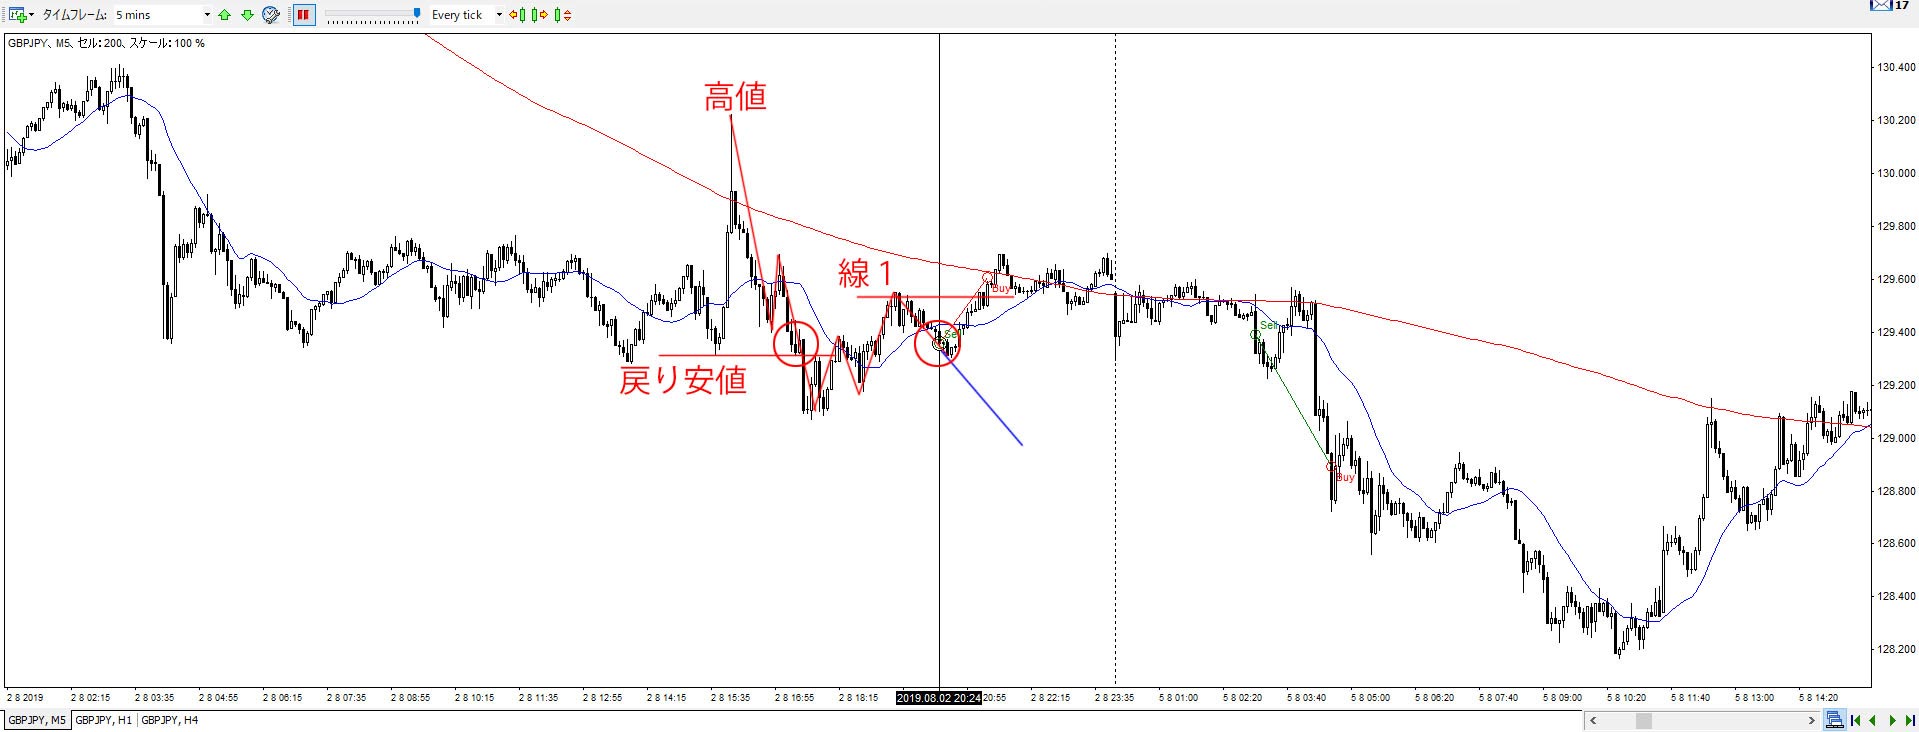
After touching the 1-hour 20 SMA (the red moving average line) at the high point, the price dropped below the previous low.
At this point, I was about to enter a short position, but the stop-loss point would have been the recent high, resulting in about an 85-pip stop loss. This would make the risk-to-reward ratio too tight, so I decided to pass on the entry.
If the price had continued to drop from that point, it would have simply meant that this trade did not fit the current trading rules, so it was a good decision to pass.
However, after watching the chart, the price went back up and approached the 1-hour 20 SMA again. When the price dropped below the 5-minute 20 SMA (the blue moving average line), I thought it would continue dropping (blue downtrend line) and entered the trade with a stop-loss set at the recent high (line 1) for 25 pips.
Although this turned out to be a losing trade, the reason for the loss is clear, so I believe it can be avoided in the future.
The following chart clarifies the cause of the loss.
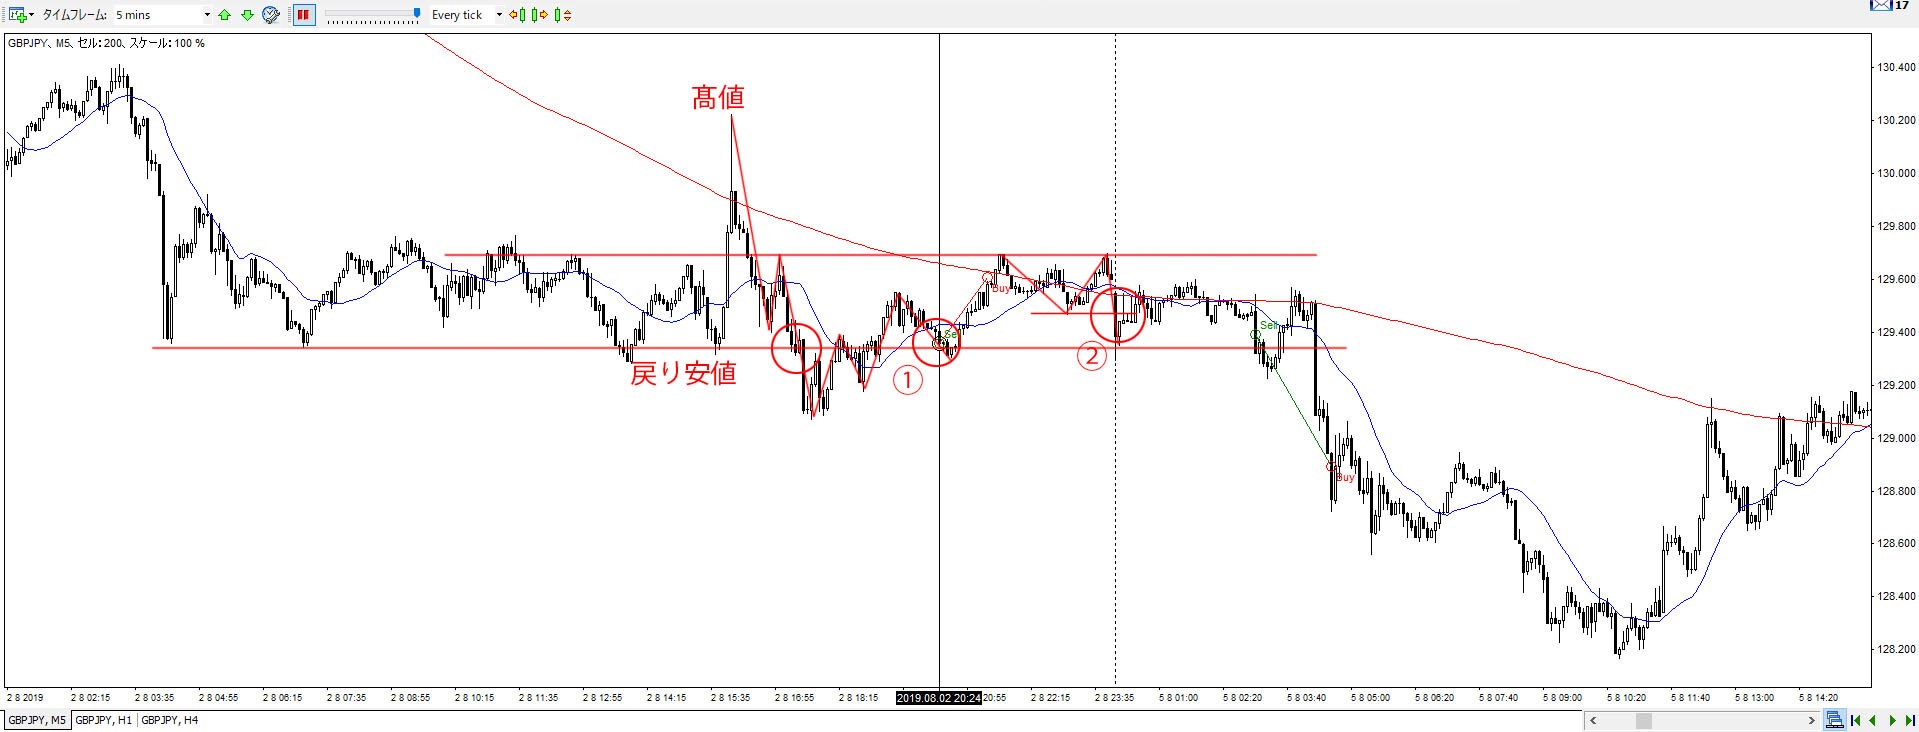
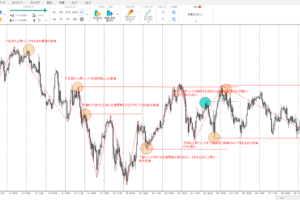
I was too focused on the price movement after the high was made, but upon closer inspection, it became clear that the 5-minute chart was in a range market (two red lines).
Looking at it as a range market, my entry at point ① was completely at the bottom of the range, making it the worst possible timing.
In this case, I should have waited to confirm that the price had broken below the range’s low before entering.
From this analysis, point ② would have been the best entry point.
The original trading rule includes, “There should be no price range (line) likely to act as resistance in the direction you are targeting.” However, since this wasn’t part of the entry rules, I overlooked it.
I plan to add the following to the entry rules:
- There are no price ranges that are likely to become resistance, such as ranges, in the 5-minute market.
Incidentally, as you can see on the right side of the chart, I entered the next trade at a good time and secured 50 pips, so even looking at just these two trades, the strategy was profitable.
It’s clear that the risk-to-reward ratio is crucial.
Analysis of the Losing Trade on August 6, 2019, at 20:00
Next is the losing trade around August 6, 2019, at 20:00.
Looking at the 1-hour chart, we can see a double bottom formed after the price dropped, followed by a break above the neckline. After the price dropped again, the neckline acted as a support line, and the 20 SMA was also respected, creating an ideal rebound pattern.
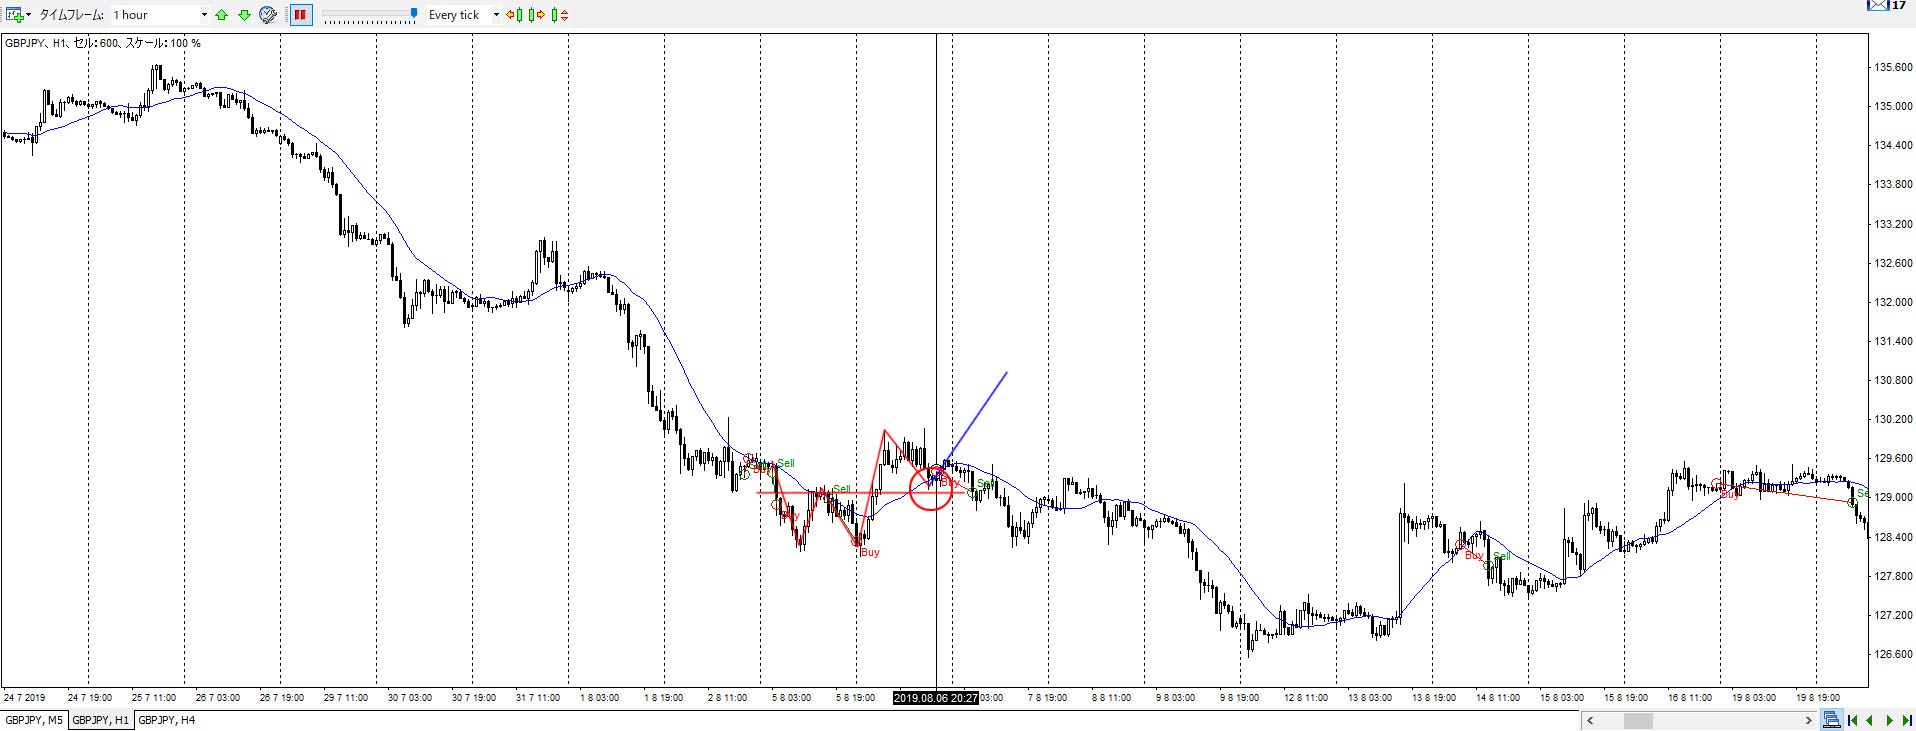
Now, let’s analyze the points that should have been considered during this trade.
The first thing to note is the 4-hour chart.
Although the 1-hour chart showed an ideal price movement, if we look at the higher time frame, the 4-hour chart, it’s clear that this was just a small pullback within a strong downtrend.
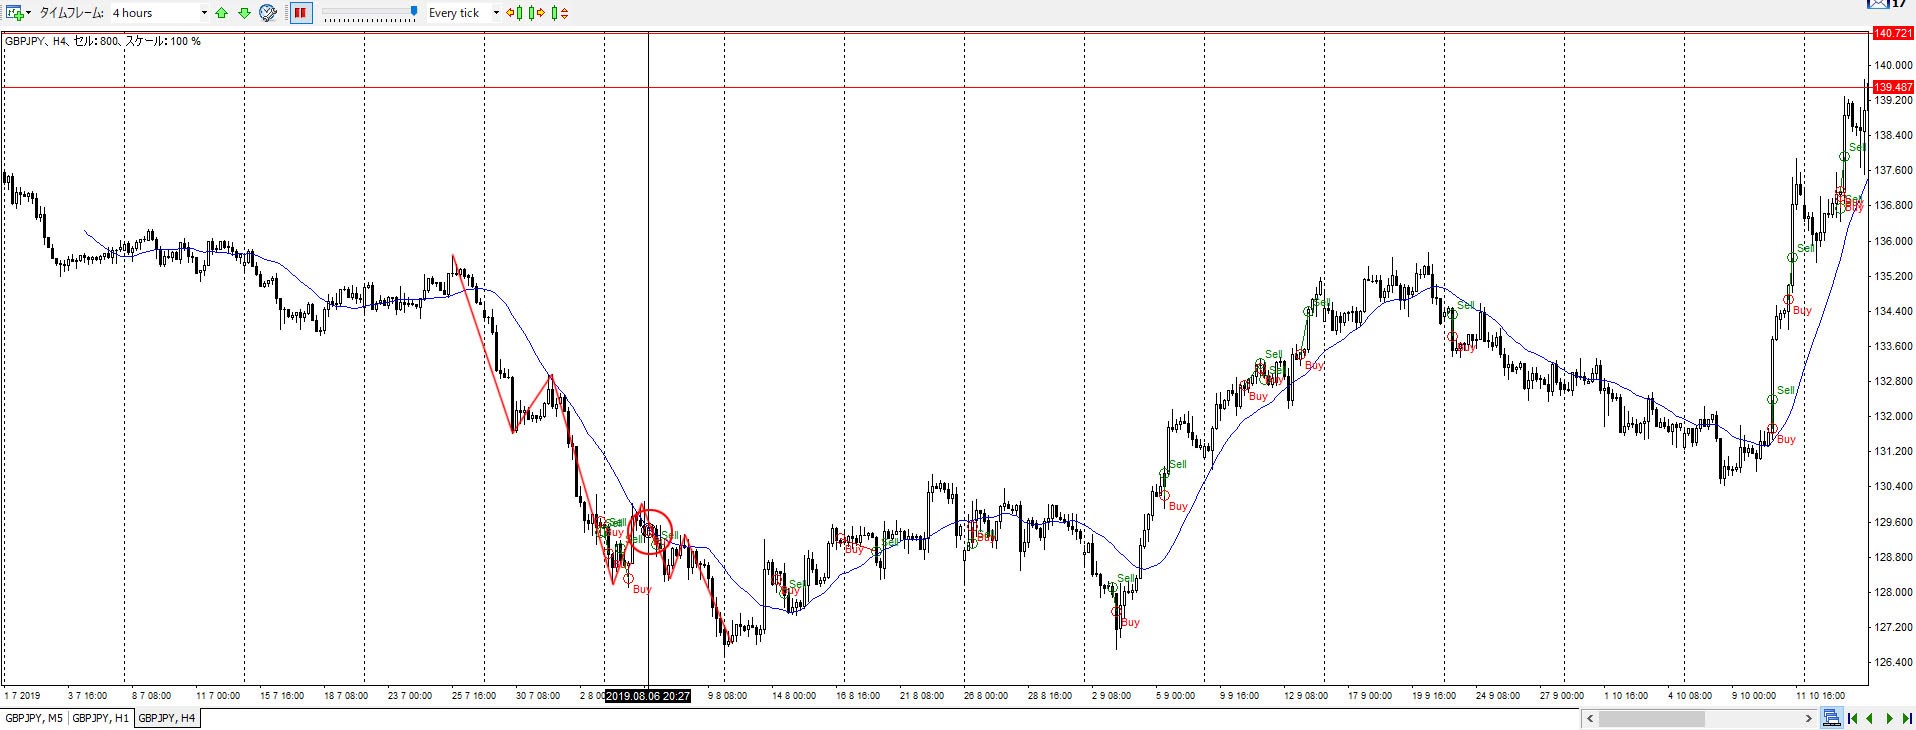
Although there is no rule in my trading strategy that says “all the moving averages on different time frames (4-hour, 1-hour, etc.) must be aligned in the same direction,” and I don’t think such a rule needs to be added, looking at this chart, even in real-time, it should have been obvious that it wasn’t the right time to enter a long trade.
While it’s not necessary to add this to the trading rules, it seems effective to lightly check the 4-hour chart’s price action as well.
Next, let’s look at the 5-minute chart, which I use to determine entry timing.
After touching the 1-hour 20 SMA at point ①, the price moved up to line ①, then dropped to point ②. At this point, since the price didn’t break below point ① and instead broke back above line ①, I entered the trade.
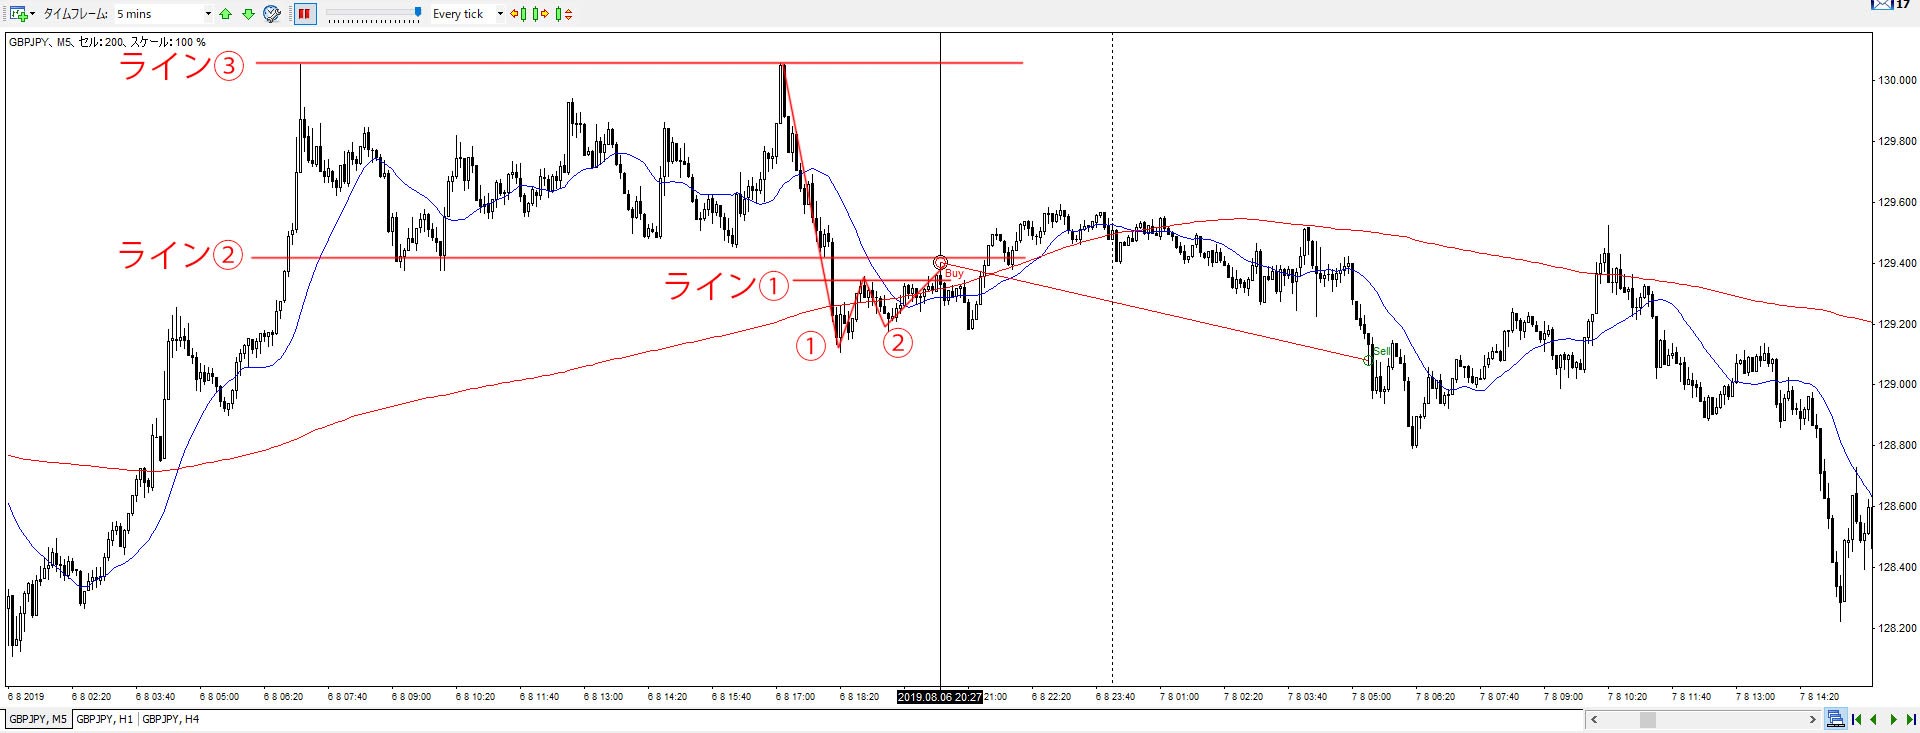
This could also be seen as a slight double bottom pattern followed by a break above the neckline, so I don’t think it was a particularly bad entry decision. However, there’s a small range between line ② and line ③.
I’ve been paying attention to ranges and lines on the 5-minute chart, but I personally don’t think it’s necessary to be concerned about every little thing on the 5-minute chart. You can draw lines almost anywhere on a 5-minute chart, and if you worry about all of them, you won’t be able to trade at all.
So, while line ② didn’t break, this is more of a hindsight observation. What I should have been paying more attention to was line ③.
Candle Wicks Hold Special Meaning in Price Action
The first high that formed line ③ didn’t quite form a pin bar, but on the 5-minute chart, it ended with a sufficiently long upper wick.
Now, let’s focus on the second high that bounced off line ③.
This is what’s often called an “engulfing pattern” or something similar, but if we combine these two candlesticks into a 10-minute candle, it forms a perfect pin bar.
The wick of a candlestick represents a price that was reached but ultimately rejected, showing that the price couldn’t be maintained or broken.
In other words, the first high ended with an upper wick, and the second one formed a perfect pin bar, indicating that many traders were paying attention to this price range.
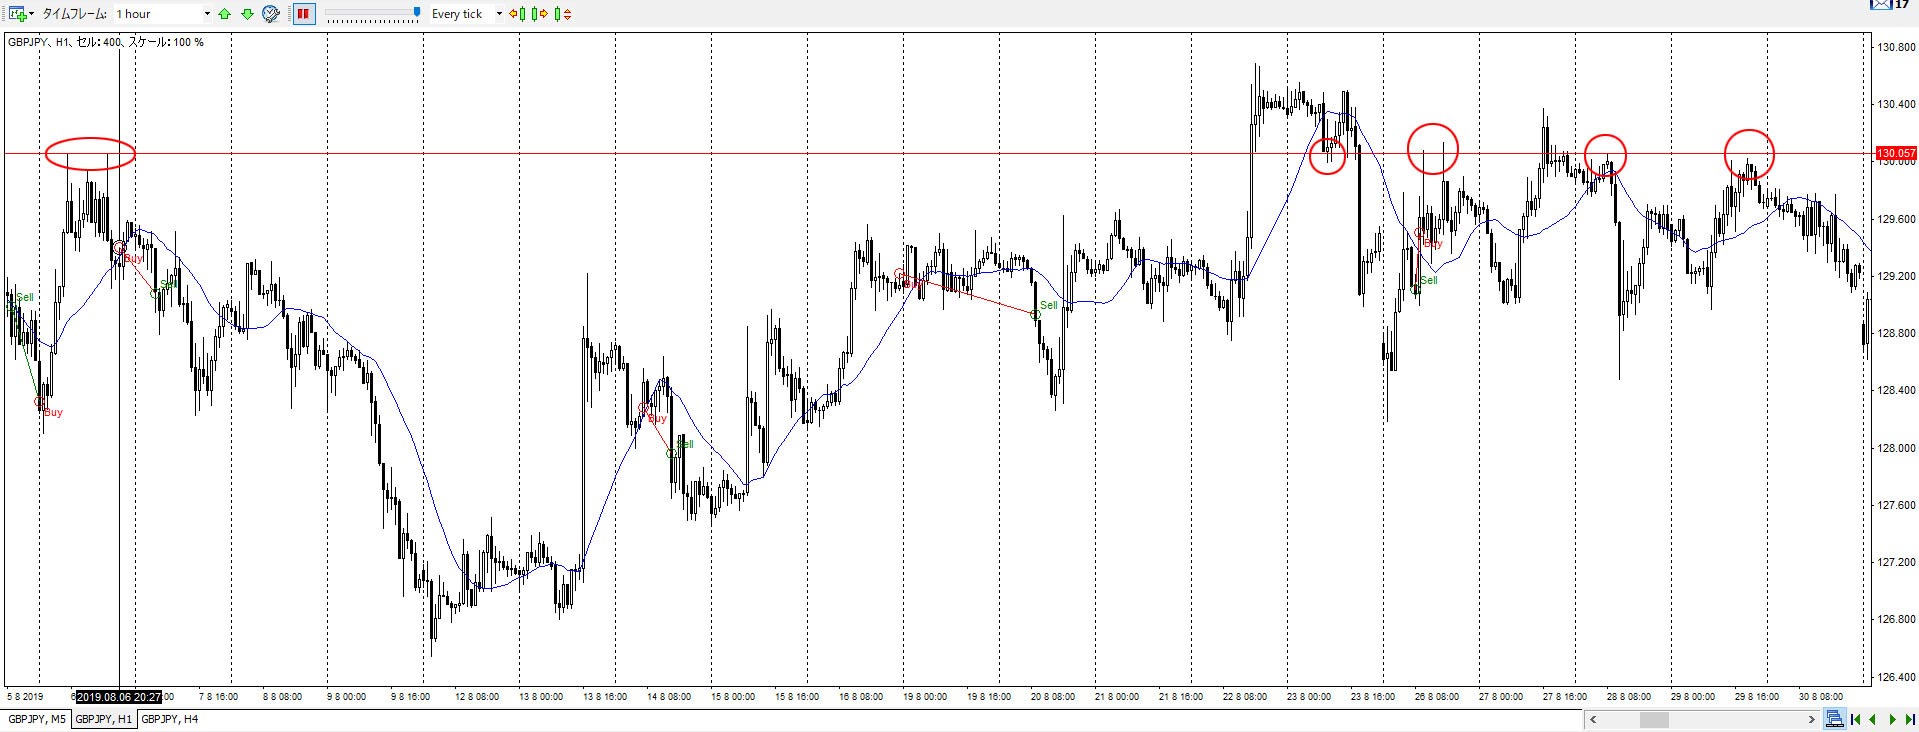
Incidentally, the following image shows what happened after line ③.
You can see that it continued to be respected as support and was repeatedly tested as a resistance line afterward.
Summary of the Moving Average Rebound Trading Strategy with a 61% Win Rate from Backtesting
This time, I backtested the rebound from the 20 SMA indicator on the 1-hour chart of GBPJPY.
In the analysis stage, I had refined the strategy to a 56.7% win rate, but that analysis was based on completed charts. When you actually backtest or trade in real-time, the win rate usually drops.
In the first backtest of this strategy, the win rate was disappointing. However, by refining and adding new rules to improve accuracy, I was able to raise the win rate to 61%, not only in analysis but also in the test trades.
That said, this result is based solely on the backtesting conducted from January 1, 2019, to December 31, 2019. If applied to different currency pairs or time periods, the results might differ.
However, technical analysis is fundamentally based on past price movements, which reflect human psychology patterns. The same goes for this moving average rebound strategy.
Since this strategy is derived from a chart pattern that many traders are aware of, I don’t believe it will stray too far off course.
Going forward, I plan to backtest various trading strategies and share the results, so I’d appreciate it if you could check back again.
There are also articles where I’ve analyzed moving average rebounds up to this point, so feel free to reference them if you like.

の使い方を分析してみたら勝率56.7のトレード手法が見つかった-486x290.jpg)
I highly recommend the FX backtesting software I use, as it allows for more efficient testing.
23 Years of Actual Historical Data
Tick Data for Timeframes Below 1 Minute
Comprehensive Support System
Final Summary of the 20 SMA Rebound Trading Strategy
- Rebounds off the 1-hour chart’s moving average (SMA).
- The moving average is set to 20.
- A touch is defined as within ±10 pips of the 20 SMA.
- A rebound is considered when the price moves more than +50 pips in the rebound direction.
- The 20 SMA should be sloping, not flat.
- There should be no price range (line) likely to act as resistance in the direction you are targeting.
- When there is a trend reversal on the 1-hour chart, consider whether it is just a pullback on the higher time frame (in this case, the 4-hour chart).
- Entry decisions and execution are made on the 5-minute chart.
- The entry should be based on Dow Theory, ensuring a statistically favorable timing.
- The direction of the 5-minute 20 SMA must be clearly aligned with the intended trade direction.
- The price must have broken and confirmed above the 5-minute 20 SMA in the intended direction.
- The stop-loss points are set at the most recent high or low according to Dow Theory on the 5-minute chart.
- The risk-to-reward ratio should be at least 1:1.5 or better.
- There should be no price range acting as resistance during the 5-minute time frame.


の使い方を分析してみたら勝率56.7のトレード手法が見つかった-300x200.jpg)
のシンプルトレンドフォロー手法を確立させるまで-300x200.jpg)