の使い方を分析してみたら勝率56.7のトレード手法が見つかった.jpg)
Among the technical indicators used in Forex analysis, the most popular ones are the Simple Moving Average (SMA) and the Exponential Moving Average (EMA), which represent moving averages.
The way people use them varies—some may use them to determine entry points, while others might only use them to confirm trends or momentum.
Common settings include values like 5, 20, 21, 25, 75, 100, and 200, as well as numbers from the Fibonacci sequence.
No matter which setting or approach you use, sometimes the price moves as expected, and other times it doesn’t, so there’s no definitive answer.
However, it’s also a fact that moving averages are the most widely used (and observed) indicators worldwide.
This is why, by analyzing and backtesting price movements using moving averages with historical data, you can discover your own advantageous settings and methods.
In this article, I’ll be analyzing price rebounds using the 20-period moving average (20SMA), which I personally use, and summarizing its win rate and specific usage strategies moving forward.
I’ll also include a basic explanation of moving averages like SMA and EMA, so feel free to use this as a reference.

記事の目次
[Analysis 1] Calculating the Rebound Rate from the Moving Average Using Recent Data
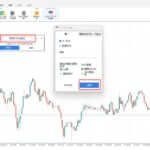
Both analysis and backtesting require a clear set of rules, especially because you’ll need to replicate any strategy you find in live trading.
Set the rules and begin analysis
- The period is from 2020/10/30 to 2020/12/18
- Analyze the 1-hour 20sma
- Check the number of times you touched 20sma (within ±10 pips above and below)
の20移動平均線の反発確認画像1-a-1-scaled.jpg)
Based on the rules mentioned above, there were 52 instances where the price touched the 20SMA.
I’ve grouped some of these touches together to an extent, but even so, there were quite a few touches when using the 20SMA on the 1-hour chart.
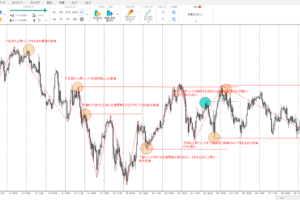
Set rules to determine what counts as a rebound and analyze
- The rebound must be within ±10 pips above and below the 20 SMA on the hourly time frame.
- After that, the price moves in the rebound direction by +50 pips or more.
の20移動平均線の反発確認画像2-a-scaled.jpg)
When I analyzed according to the rules above, there were 22 instances where the price rebounded.
There were 52 touches of the 20SMA, and among those, 22 can be considered rebounds. Therefore, the rebound rate for the 20SMA on the 1-hour chart is calculated as follows:
Rebounds: 22 / Touches: 52 * 100 = 42.3%
This means that roughly 2 to 3 out of every 10 touches result in a rebound.
[Analysis 2] Focusing on High-Win-Rate Strategies to Increase Profitability
This is where things get important.
Even with the previous rules, the rebound rate was around 40%, so theoretically, if you stick to trades with a 3:7 risk-reward ratio, you could still turn a profit!
However, personally, I’d like to improve the win rate a bit more.
To do this, I’ll add one more rule to the original 20SMA touch criteria.
- The period is from 2020/10/30 to 2020/12/18
- Analyze the 1-hour 20sma
- A touch is considered to be within ±10 pips above or below 20sma.
- (Additional) 20sma should be oriented either upward or downward, rather than horizontally.
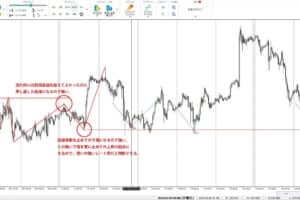
の20移動平均線の反発確認画像3-a-scaled.jpg)
As a result of this additional rule, the number of touches on the 20SMA was reduced to 30.
Now, let’s continue analyzing the number of rebounds from the 20SMA using this updated rule.
To summarize the new rules:
- The rebound must be within ±10 pips above or below the 20 SMA on the 1-hour time frame.
- The price then moves in the direction of rebound by +50 pips or more
- (Additional) 20sma should be oriented either upward or downward, rather than horizontally.
の20移動平均線の反発確認画像4-a-scaled.jpg)
There were 17 confirmed rebounds from the 20SMA.
Now, when considering the direction of the moving average, the rebound rate for the 20SMA is calculated as follows:
Rebounds: 17 / Touches: 30 * 100 = 56.7%
Not bad at all.
Compared to the previous rules, the number of trades decreases slightly, but we’ve narrowed it down to the point where there’s a rebound roughly once every two trades out of 10.
Summary of the Analysis of the Rebound Rate for the 20-Period Moving Average on the 1-Hour Chart
So far, I’ve analyzed the rebound rate for the 20-period moving average (MA) on the 1-hour chart of GBP/JPY (British pound to Japanese yen) and narrowed down the trading rules to achieve a rebound rate of approximately 56.7%.
Of course, there are other ways to use moving averages, and adding more rules might further improve the win rate. However, overcomplicating the rules will reduce trading opportunities, so personally, I’m fine with a win rate of around 50%.
From here, it’s all about adjusting the risk-reward ratio and managing capital, which should help increase profitability.
That said, there are still no specific entry criteria or entry rules established for actually trading with this strategy.
The current rules are based solely on an analysis of past charts, and while this is useful, in live trading, you’re unlikely to achieve the same win rate with these exact settings.
While Forex charts do sometimes follow familiar patterns, they don’t always behave in the same way.
This is especially true for moving averages, which are calculated as the average of closing prices over a certain number of candles. For example, when looking at past charts, you may see that the price barely touched the moving average, but in real-time, it might not have touched at all.
This happens because, after a sharp price movement, the average is finalized, making it appear as if the price just touched the moving average on the historical chart.
In this way, analyzing only past charts doesn’t provide a strategy that can be fully replicated in real-time trading, so it’s essential to continue refining the method using backtesting software to establish a more robust strategy based on the 20-period moving average.
I’ve also written a separate article covering entry rules and decision-making criteria for this trading strategy, so feel free to check that out for reference.


のシンプルトレンドフォロー手法を確立させるまで-300x200.jpg)