Hello everyone, this is Pip, your FX trader (〃 ˆᴗˆ 〃 )
Here is the article presenting the test results of the simple trend-following strategy using just one moving average line that I introduced last time.
I’ll be sharing the results of my backtesting based on this trading method, along with the additional rules and reasons for their inclusion that were added to enhance the strategy.
If you check out the previous analysis article, you’ll gain a better understanding of the theory and rationale behind this method, so please refer to it as well.
のシンプルトレンドフォロー手法を確立させるまで-486x290.jpg)
Alright, let’s get started!
記事の目次
- 1 Simple Trend-Following Strategy Using the 20-Period Moving Average: Currency Pairs and Time Frame Settings
- 2 Simple Trend Following Trading Rule Using Only One Moving Average
- 3 Results and Analysis of the Trading Strategy Using the 20-Period Moving Average
- 4 The Truth About the 20-Period Moving Average Strategy Revealed Through Backtesting
- 5 Simple Trend Following Strategy Using the 20-Period Moving Average: Comprehensive Summary of Backtesting Results
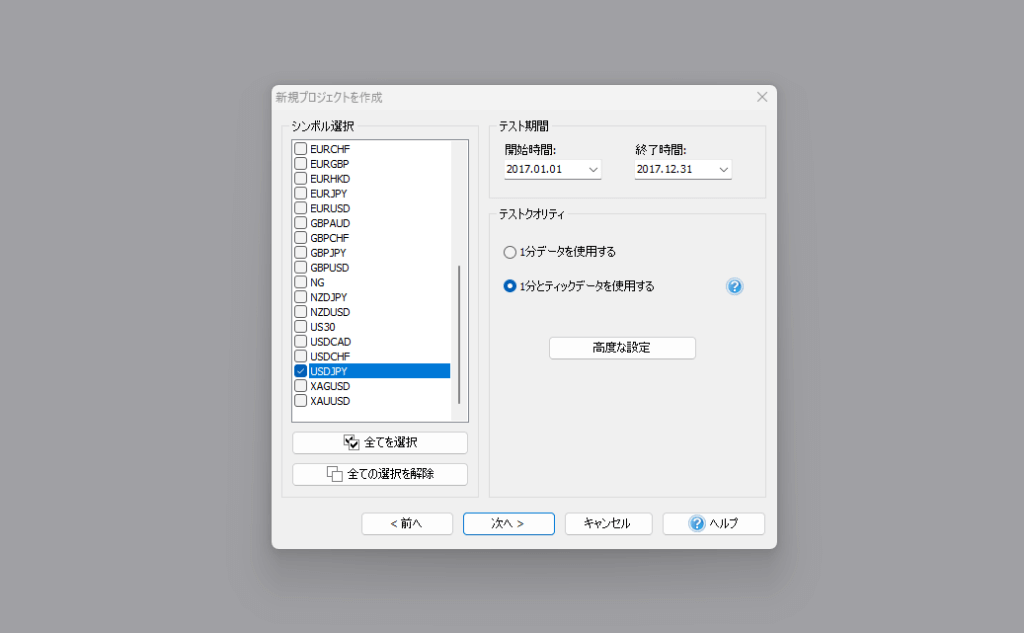
Simple Trend-Following Strategy Using the 20-Period Moving Average: Currency Pairs and Time Frame Settings
| Past verification information | |
| Currency pair | USDJPY |
| Analysis period | January 2017 – December 2017 |
| Main axis time frame | 1 hour foot |
Simple Trend Following Trading Rule Using Only One Moving Average
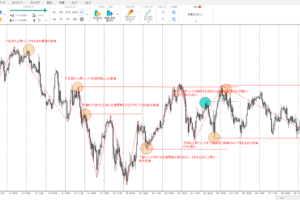
Let me introduce the rules of the trading strategy we will backtest.
- Moving Average (SMA) setting is 20.
- It must be clearly sloping in either direction.
- A pullback is identified when the candlestick moves against the slope of the moving average.
- Entry condition: Enter when the candlestick crosses the moving average again while the slope is maintained.
- Stop loss: Exit when the candlestick crosses against the slope of the moving average again.
We will backtest the above trading rules for now, and finally, we will summarize additional rules based on the test results to stabilize the win rate.
Results and Analysis of the Trading Strategy Using the 20-Period Moving Average
Let’s dive straight into the backtesting results.
Although it might seem sudden, the actual backtesting took around 2 to 3 hours, followed by roughly an hour of re-analysis.


| Past verification statistical data | |
| Total number of trades | 37 trades |
| Number of winning trades | 33 trades |
| Number of losing trades | 4 trades |
| Winning rate | 89% |
| Losing rate | 11% |
| 1 trade maximum profit | 265.99pips |
| 1 trade maximum loss | 31.86pips |
| Average profit | 78.83pips |
| Average loss | 22.97pips |
| Average risk reward(RR) | 1:3.432 |
Since this trading strategy does not have predetermined stop-loss and profit targets at the time of entry, the RR was calculated based on the average profit and average loss from the backtesting results.
What do you think?
The win rate and maximum profit are outstanding, aren’t they? (◦ˉ ˘ ˉ◦)
Even the average RR exceeds 3, and the ratio of maximum profit to loss is about 9 times.
While the “Strong Rate Zone Targeting Method” I introduced previously had an incredible win rate, I personally wanted a bit more trading frequency. This time, I’m very satisfied in that regard as well.
In forex trading, the basic principle is to buy at a low price and sell at a high price (and vice versa). However, aiming for the bottom too much won’t always hit the mark. As a result, many people start entering trades around the average of the current price movement.
Trading strategies using moving averages are based on the market psychology of many traders, so these backtesting results are quite convincing (˶ᵔ ᵕ ᵔ˶).
The Truth About the 20-Period Moving Average Strategy Revealed Through Backtesting
I am satisfied with this simple trend-following strategy using only one moving average (set at 20), and the backtesting results are also very satisfying. However, after trading in a live market, I’ve discovered a few insights. I’d like to summarize these findings as a final note.
Fewer Trading Opportunities Than During Analysis
During the analysis phase of this strategy, I found 138 trading opportunities over two years, which should translate to about 69 opportunities per year.
While I understand that changing the target period for analysis and backtesting means results won’t be identical, the actual backtest revealed only 37 trades in a year—significantly fewer than expected.
The reason for this discrepancy lies in the fact that this strategy uses a moving indicator like the moving average, which fluctuates with price movements.
During the analysis phase, both the moving average and candlesticks were already settled, so even minor movements were considered. However, in a live market, it was not possible to achieve such perfect entries.
One might think that waiting for both the hourly candlestick and the moving average to settle before entering a trade would help, but this results in delayed entries, increasing the stop-loss distance and worsening the RR.
While the trading frequency is lower than during the analysis phase, I believe it is still sufficient and does not require adjusting the strategy to allow for larger stop losses.
After Entry, Monitor Price Movements Using the 5-Minute Chart
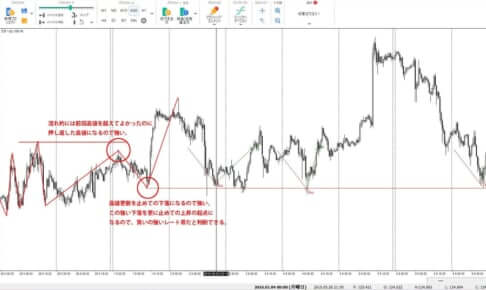
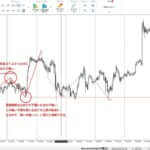
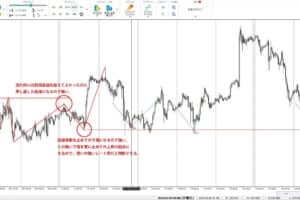
This method addresses the issue of widening the stop-loss. The basic approach is to use the 1-hour moving average, but when the trading conditions are about to be met, you draw a horizontal line at the moving average price level on the 1-hour chart. You then enter the trade when the 5-minute chart breaks this horizontal line.
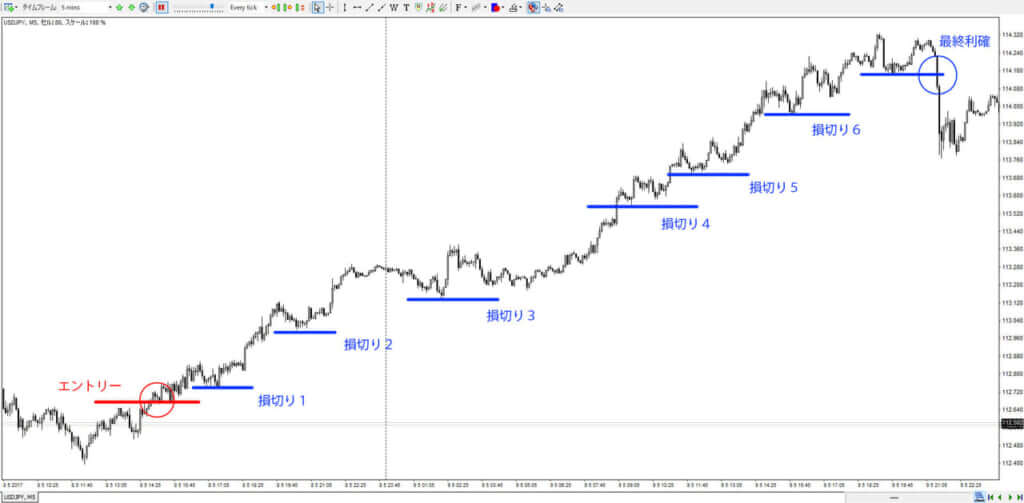
After entering, continue monitoring the price movements using the 5-minute chart and adjust the stop-loss level accordingly.
In strategies like this, which use moving averages, it’s inherently difficult to set a definitive take-profit level. Therefore, the final take-profit decision is made by adjusting the stop-loss level according to the price movement, or by adding another rule for taking profit.
To minimize the stop-loss width while maximizing potential profit, we choose to follow the price movement using the 5-minute chart.
Here’s an example of a chart where the stop-loss level is adjusted using the 5-minute chart after entry.
Simple Trend Following Strategy Using the 20-Period Moving Average: Comprehensive Summary of Backtesting Results
It was truly beneficial to test this strategy in a live market, as I discovered various insights that weren’t apparent from analyzing settled charts alone.
I’ve added trading rules that can further improve the win rate and profitability, and I believe the strategy has now reached a level where it can be effectively used in real trading.
Now, let’s wrap up by summarizing the trading rules for the simple trend-following strategy, including the additional rules.
- Moving Average (SMA) setting is 20.
- The moving average must be clearly sloping in either direction.
- A pullback is identified when a candlestick moves against the slope of the moving average.
- Entry condition: Enter when the candlestick crosses the moving average again while the slope is maintained.
- Entry timing: Execute the entry when a candlestick on the 5-minute chart crosses in the direction of the 1-hour SMA slope.
- Initial stop-loss: Set the initial stop-loss at the high/low of the 5-minute candlestick at the time of entry.
- Take-profit condition: Take profit when the 5-minute trendline is broken or when the price falls below the 5-minute high/low.
I encourage everyone to test the trading strategies they discover through their own analysis or those they hear about from others. By doing so, you can establish a truly personalized trading strategy that suits you best.
23 Years of Actual Historical Data
Tick Data for Timeframes Below 1 Minute
Comprehensive Support System

のシンプルトレンドフォロー手法を確立させるまで-300x200.jpg)
の使い方を分析してみたら勝率56.7のトレード手法が見つかった-300x200.jpg)