記事の目次
What is Forex Tester?
Forex Tester is a simulation and backtesting tool for FX (foreign exchange trading). This software allows traders to perform trade simulations in a virtual environment and evaluate the performance of trading strategies and expert advisors (EAs).
Forex Tester uses historical forex market data for simulations, enabling traders to verify the performance of their strategies before applying them in real-time markets.
Features of Forex Tester
Forex Tester is an invaluable tool for traders, offering the following features:
Utilization of Historical Forex Market Data
Forex Tester uses historical forex market data for simulations, allowing traders to analyze real market movements from the past and refine their trading strategies accordingly.
Accelerated Simulation (Backtesting)
Forex Tester can execute backtesting at high speeds. Traders can adjust the speed of time progression, such as candlestick movements, and rewind the data, allowing for more simulations in a shorter period. This flexibility enables traders to test various trading strategies at their convenience.
Creating Trade Signals
Trade signals refer to executing trades when specific conditions are met.
To create trade signals using Forex Tester, traders first analyze market data to identify patterns that trigger these signals. These patterns are then programmed into Forex Tester to generate trade signals.
Creating trade signals with Forex Tester is a powerful tool for improving trading strategies and enhancing trading performance. Moreover, the trade signals created with Forex Tester can be used in actual trading.
By utilizing these features, Forex Tester allows traders to refine their trading strategies, ensuring they are well-prepared before entering the live forex market.
Testing Automated Trading Software (EA)
With ForexTester, you can test automated trading software known as Expert Advisors (EAs).
An EA (Expert Advisor) is an automated trading software for forex trading that executes trades based on pre-set trade signals and algorithms.
Traders can use ForexTester to evaluate the performance of EAs and select the most optimal one.
Creating Reports and Graphs of Results
The report and graph creation features in ForexTester are extremely useful for traders, offering the following benefits:
- Visualization of Simulation Results: ForexTester allows you to create reports and graphs of your simulation results. This enables traders to visually analyze their simulation outcomes.
- Numerical Analysis: With ForexTester’s report creation feature, traders can numerically analyze the results of their simulations. This helps traders accurately identify areas for improving their trading strategies.
- Comparison and Evaluation: ForexTester can generate reports and graphs for multiple simulation results. This allows traders to compare and evaluate the performance of various trading strategies and EAs.
- Learning Support: The report creation feature in ForexTester also aids in learning. By using reports and graphs, traders can precisely understand the improvement points of their trading strategies.
By utilizing these benefits, traders can enhance their trading strategies and improve their trading performance.
How to Download and Install ForexTester
To start using ForexTester, you first need to download and install it on your PC. I’ve outlined the steps I took when I first purchased ForexTester in a separate article, so please refer to that for detailed instructions.
- Download ForexTester
- Install on Your Local PC
- Register the License Key

At this point, you are ready to start using ForexTester.
However, there is another procedure I recommend, which I would like to introduce.
Following this additional step can affect your monthly fixed costs, so please consider it.
In addition to the initial purchase cost of the ForexTester software, there is a monthly subscription fee.
By following these steps, you can continue to use ForexTester for free every month:

Basic Usage of ForexTester
Now that you are ready to perform simulations (backtesting) with ForexTester, let’s move on to how to use the simulation feature.
Even though “simulation” can mean many things, ForexTester offers a wide range of capabilities. You can perform basic simulations to test your trading strategies using actual historical data, create trade signals, and test EAs as explained earlier.
However, creating and executing EAs and trade signals are functions best suited for those with prior knowledge of FX trading. Here, I will explain the basic usage of ForexTester for simulating patterns and trading strategies you have discovered through your analysis.
How to Create a Simulation Environment (Project)
First, when you start ForexTester, a blank gray screen will appear.
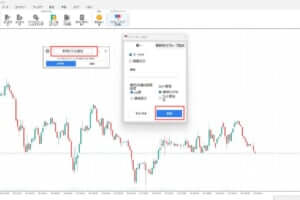
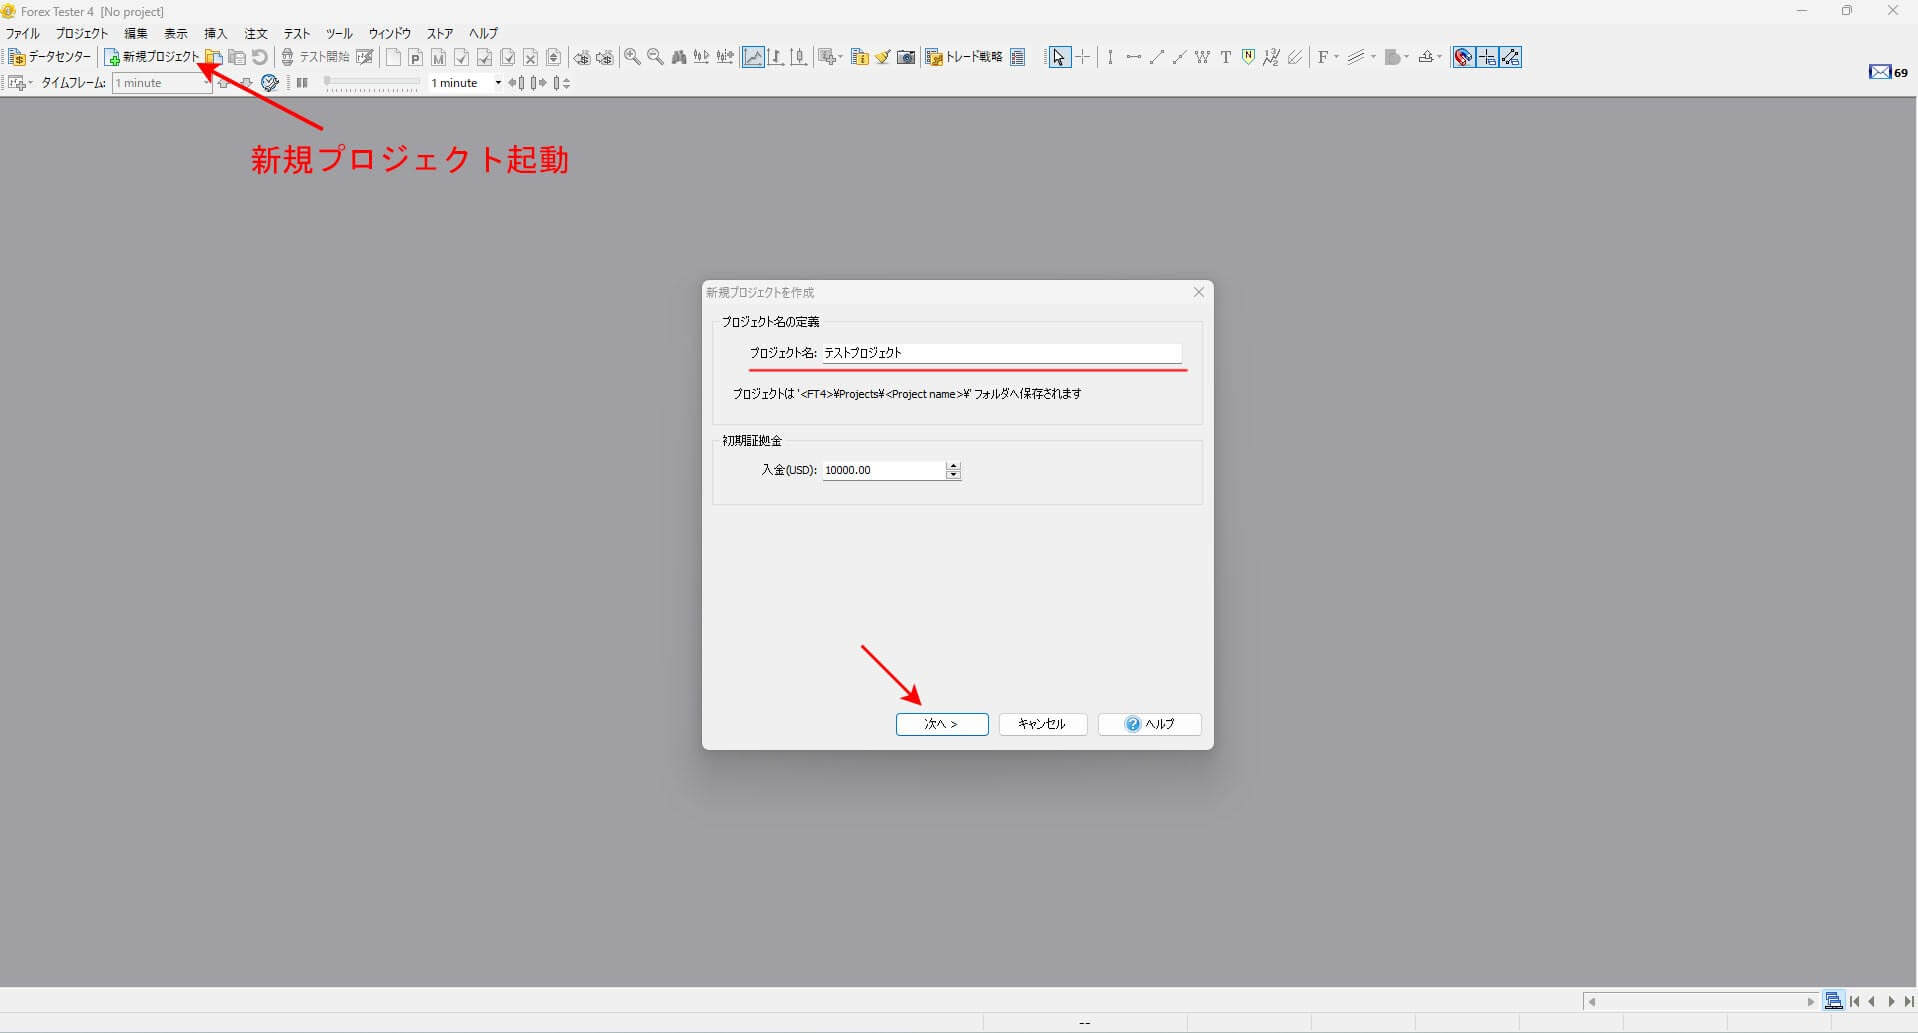
Click on “Project” in the menu or the “New Project” button at the top left of the screen. This will display the “Create New Project” popup.
Enter an appropriate project name. You can leave the initial deposit amount as the default and click “Next.”
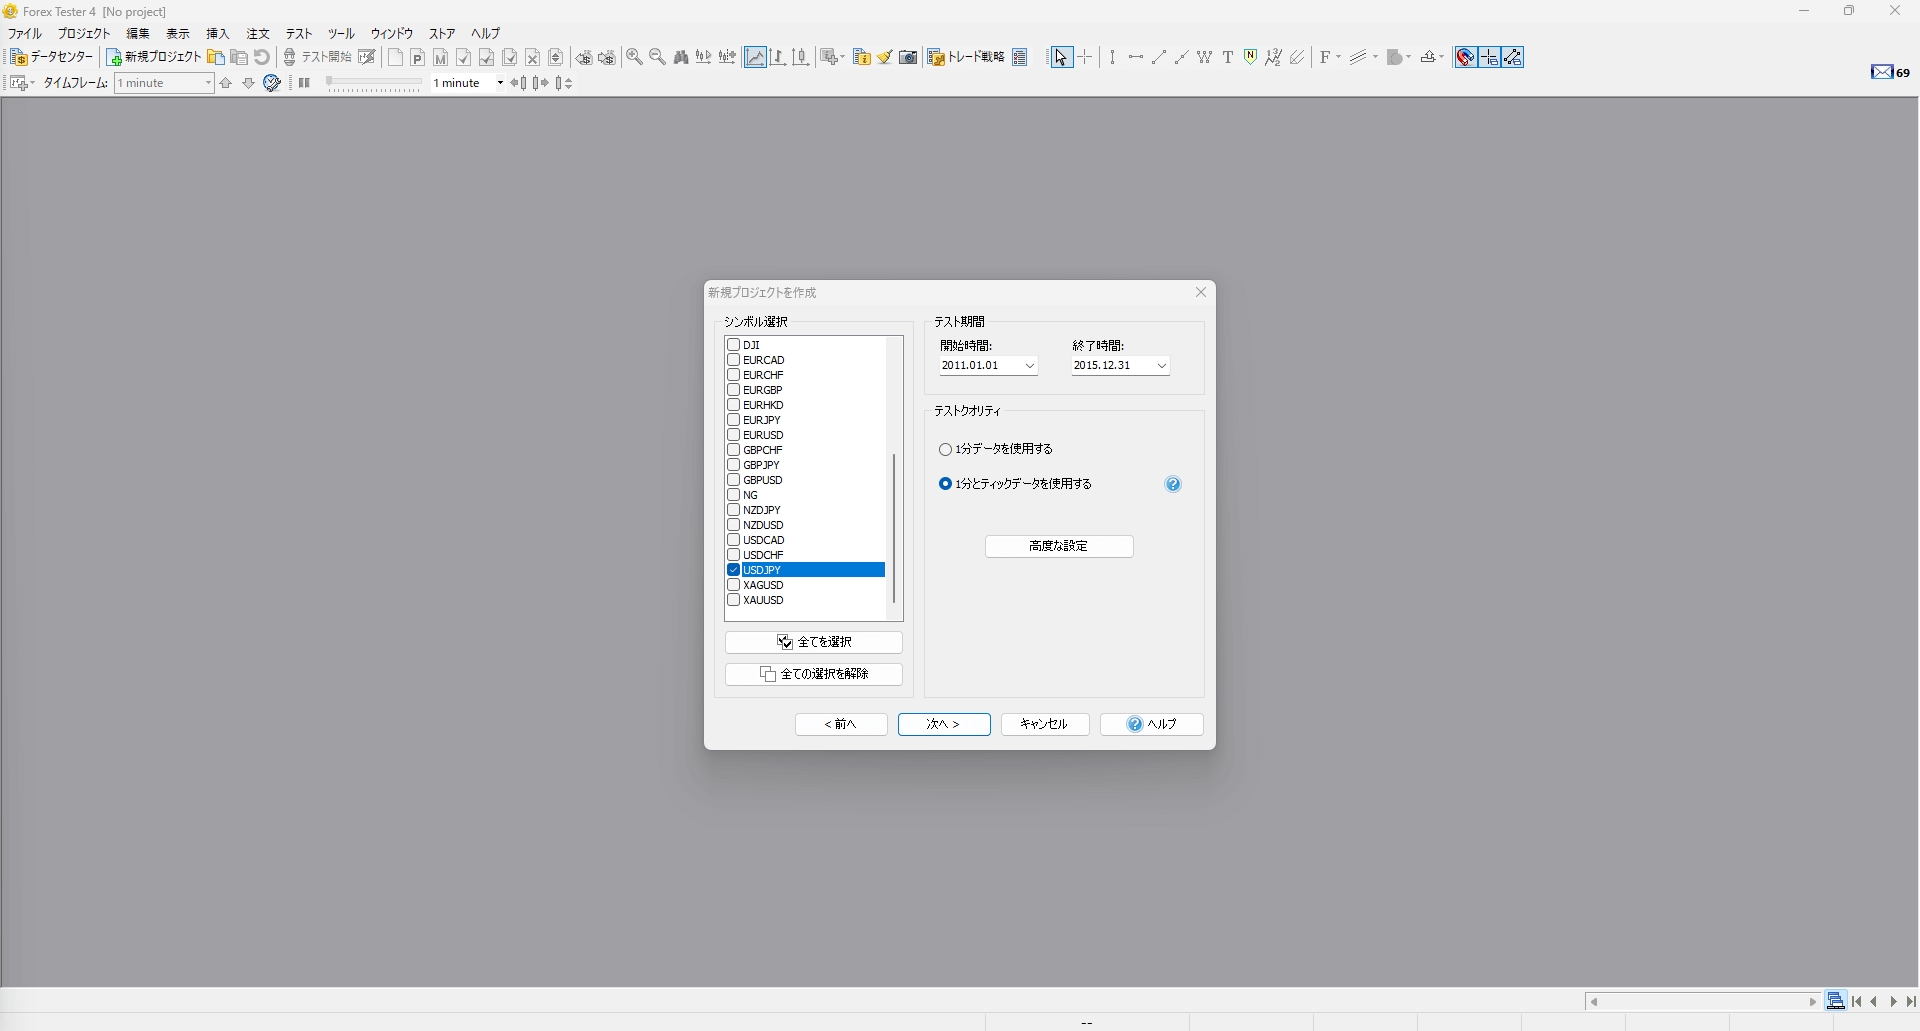
Here, you will set the currency pair and the test period for the simulation.
Tick data refers to data smaller than 1-minute candlesticks.
In other backtesting software, the smallest unit often used is the 1-minute candlestick, but ForexTester uses tick data to replicate price movements up to the formation of the 1-minute candlestick.
This creates an environment that closely mimics real-time trading.
Next are the “Time Zone” and “Test Start Time” settings, along with other configuration options.
First, the time zone setting determines which market’s close will be used as the boundary for each day or week on the chart.
I choose the New York close time, but this can vary from person to person, so it’s fine to use Japan time if you prefer.
For the test start time, this sets the date and time when the testing begins within the period specified in the previous screen.
For example, if the test period is set from January 1, 2011, to December 31, 2015, and you set the test start time to June 1, 2011, the chart will be generated from January 1, 2011, to June 1, 2011, and then the test will begin from that point.
This might still be hard to visualize, so I’ll explain further once this test project is created.
For now, let’s proceed by setting the test start time to June 1, 2011, as in the example.
Finally, in the “Other” settings:
“Start test after creation” means, as the name suggests, that the test will begin immediately once the project is created.
Even if the test starts right away, it can be stopped immediately, so I usually check this option to start the test right away.
“Forward-only mode” refers to a feature in ForexTester that allows you to rewind time during testing. For example, if you want to review price movements by candle during the test, you can rewind time on the spot.
This setting determines whether to enable or disable this feature within the project. For this project, I will leave it unchecked.

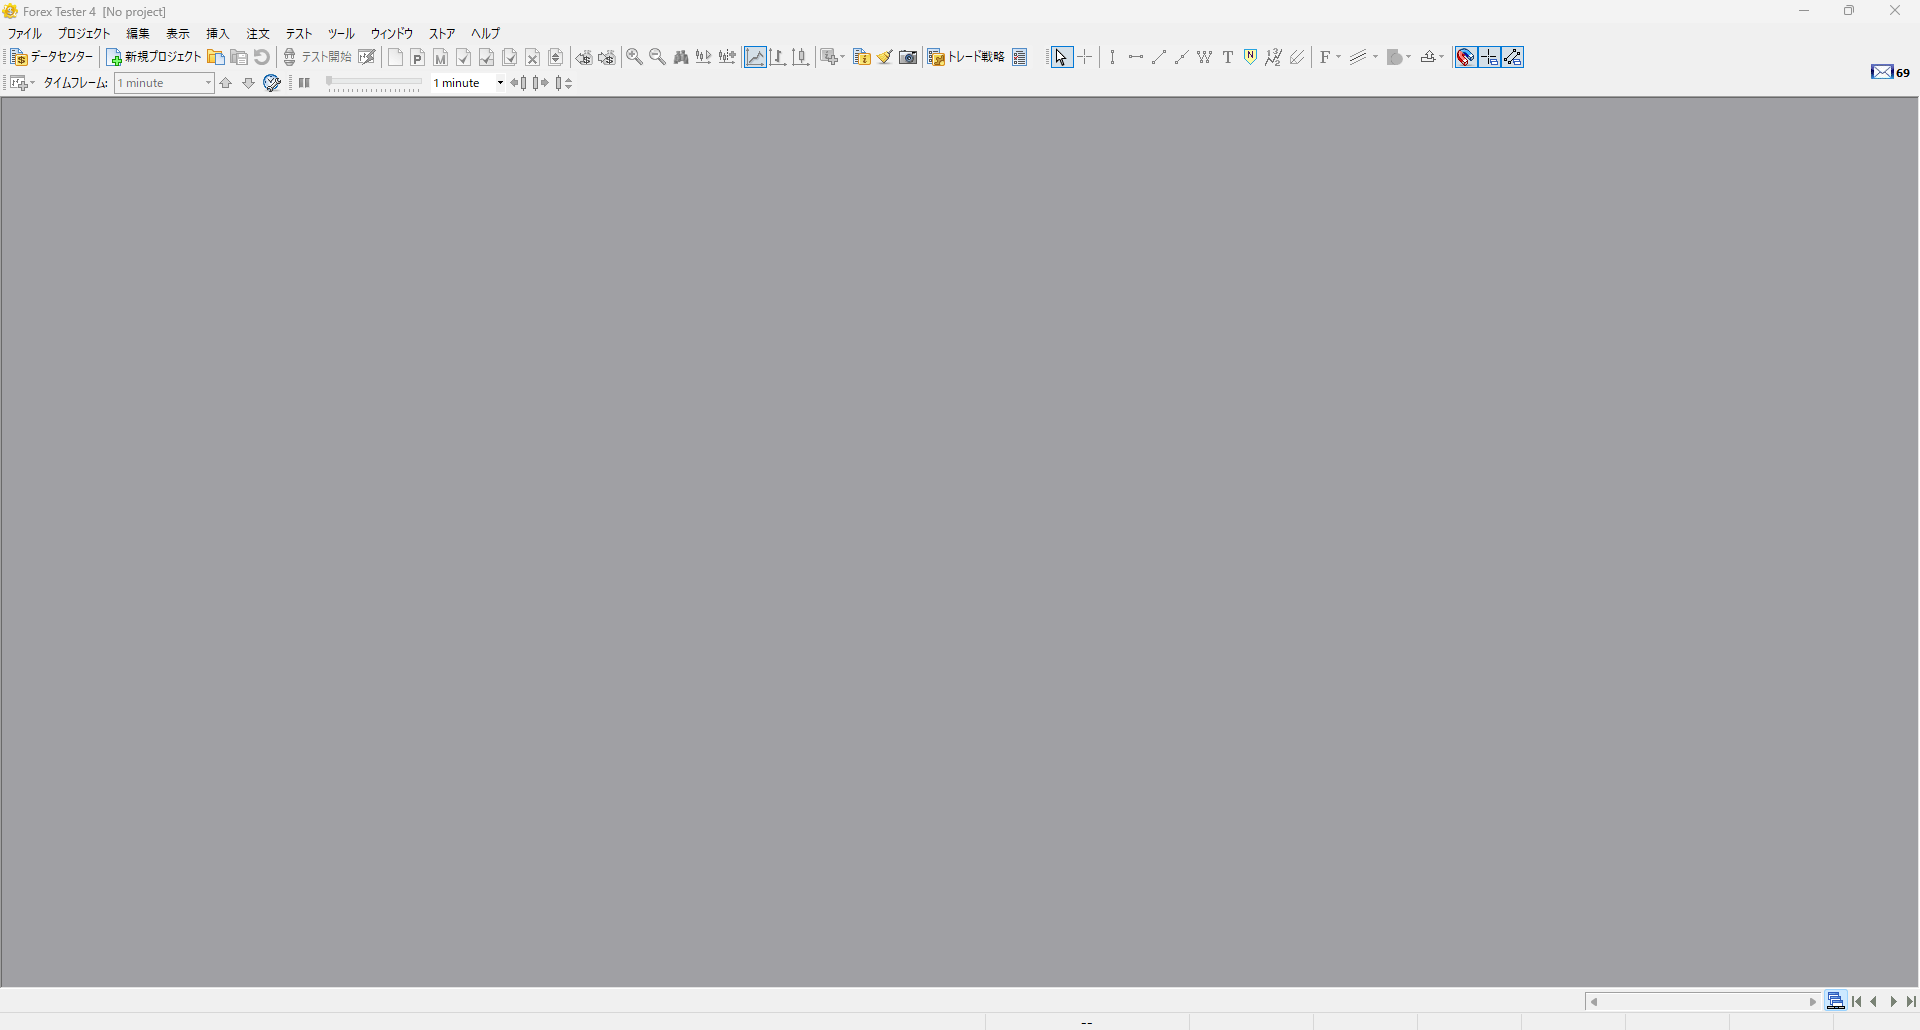
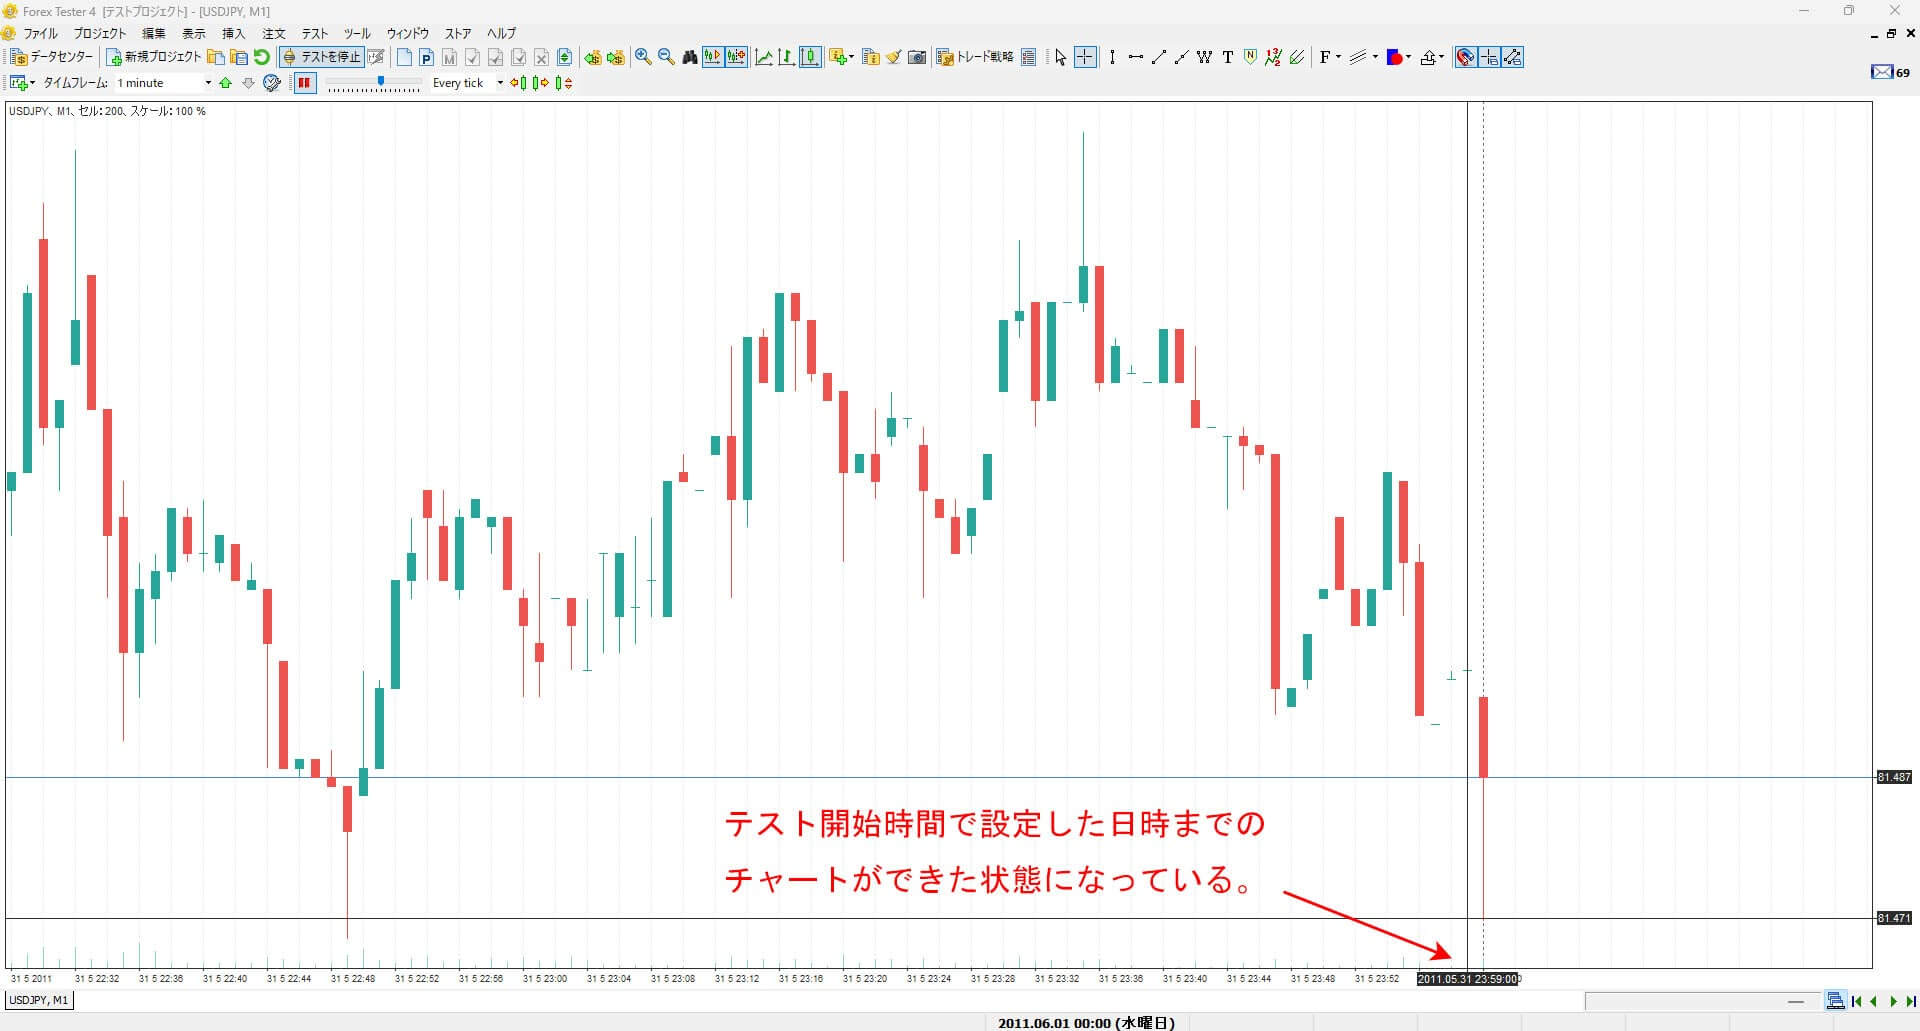
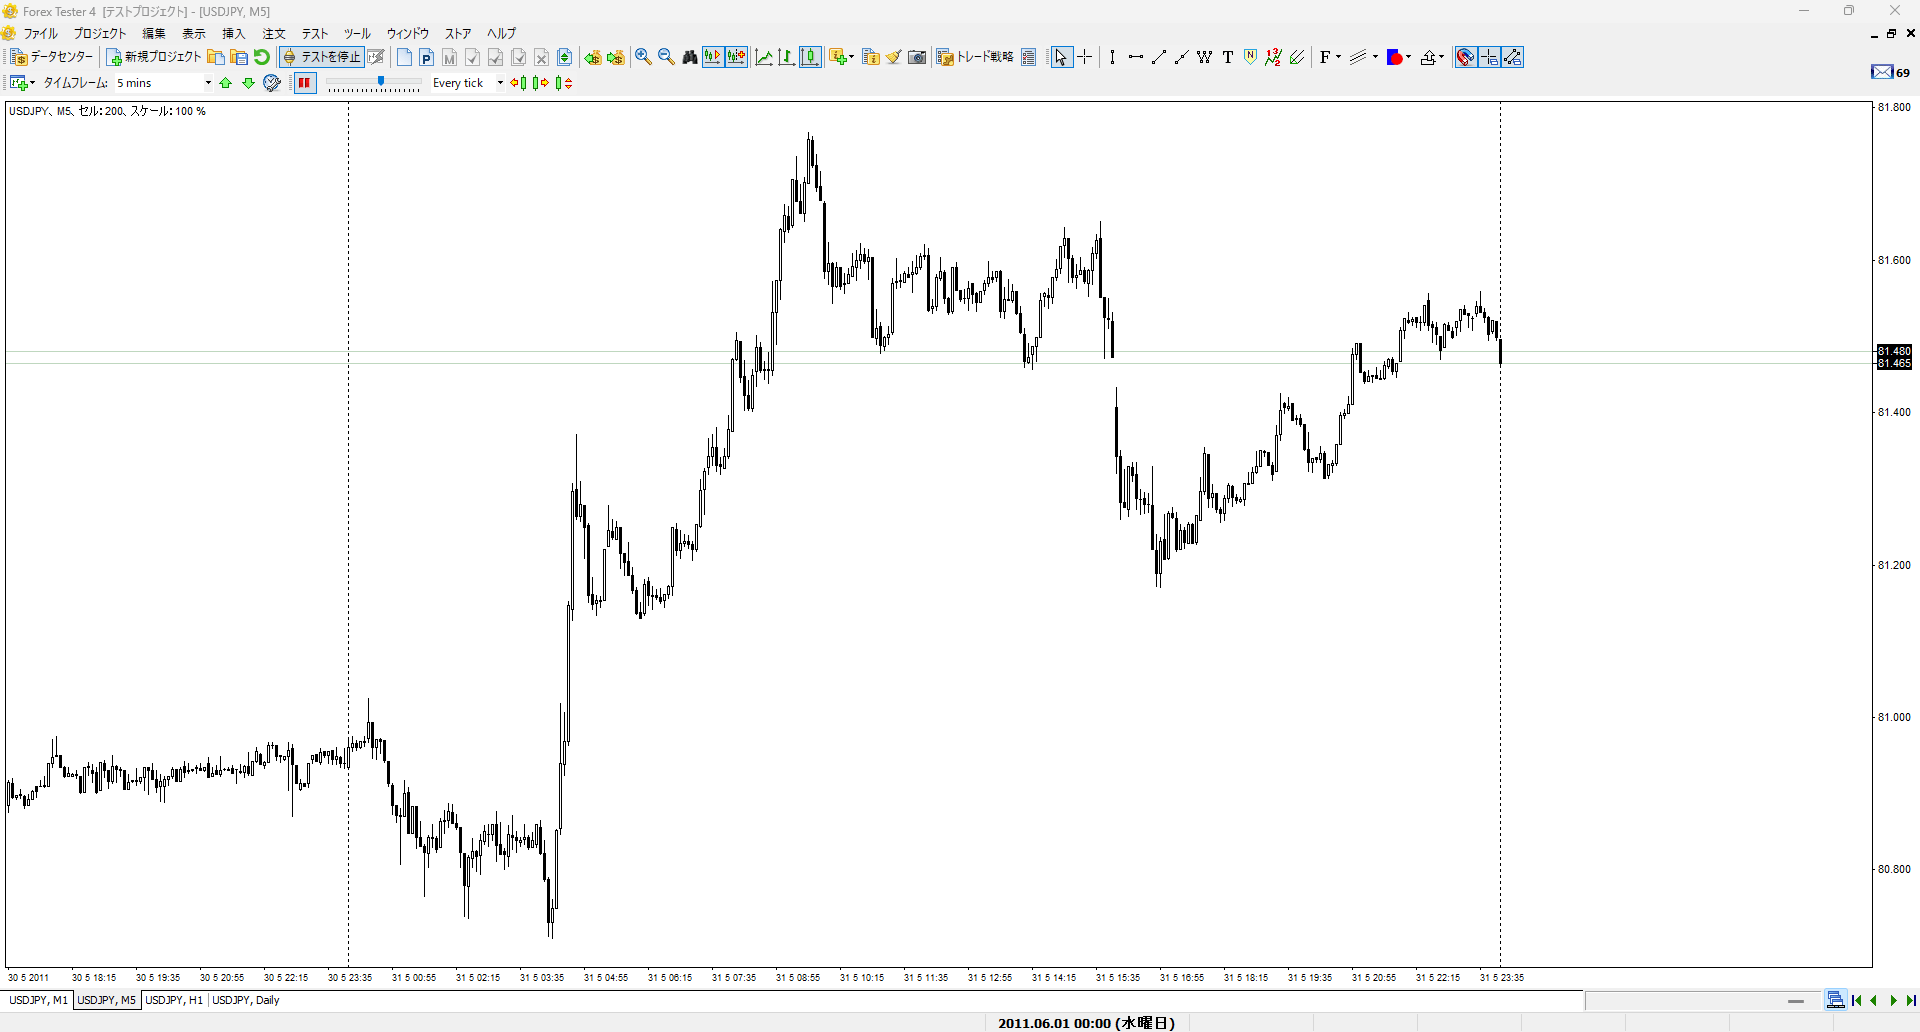
The following image shows the screen immediately after creating a new project.
All chart settings, such as candlestick colors and time frames, are set to ForexTester’s default values.
If you check the date and time of the latest candlestick at the right edge of the chart, you will see that it starts on June 1, 2011, as explained earlier for the test start date.
In this way, the “test start time” refers to the “start date and time after creating the project.”
This completes the creation of the test environment.
Next, I will briefly explain each button and how to operate them. For now, this is the basic simulation environment in ForexTester.
How to Operate Each Tool in the Simulation Environment
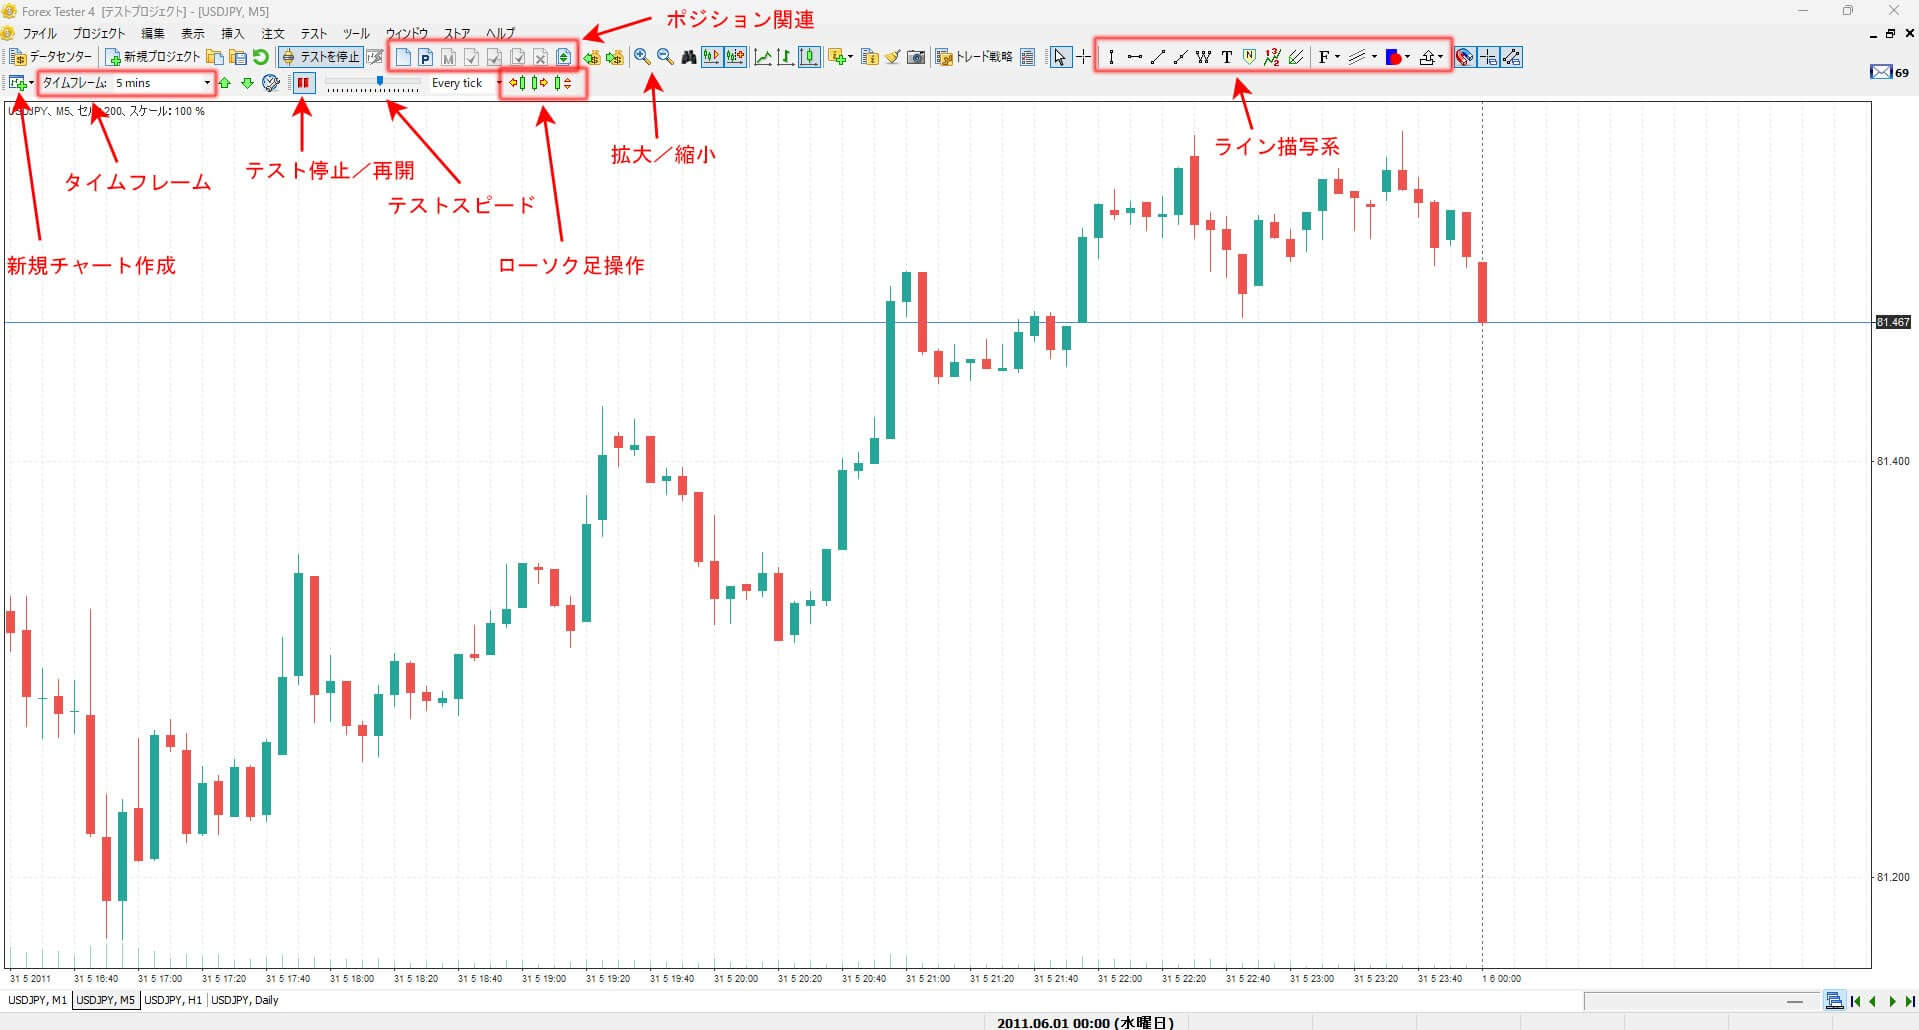
Next, I will briefly explain the functions of each button and how to operate them.
Button Functions Explained

Create New Chart
This function creates a new chart screen in a new tab.
If you look at the bottom of the reference image, you can see that chart tabs have been created for 1-minute, 5-minute, 1-hour, and daily charts.
By changing the timeframe of the candlestick for each chart in this way, you can easily perform multi-timeframe analysis (MTF).
Timeframe
This function allows you to change the timeframe of the currently open chart.
You can use it to change the timeframe on a tab-by-tab basis, as explained earlier, or change the timeframe on the same chart screen while doing MTF analysis.
Test Stop/Resume Button
As the name suggests, this button is used to stop or resume the market movement during testing.
Test Speed
The test speed feature is very convenient as it can shorten the testing time.
By adjusting this bar, you can speed up or slow down the flow of time during the test.
Candlestick Operation
The left button for candlestick operation is “rewind,” the middle button is “forward,” and the rightmost button allows you to move forward tick by tick.
The rewind and forward buttons move the time forward or backward by the candlestick unit of the current timeframe.
The tick operation button allows you to move forward in time at the smallest unit of tick level, regardless of the timeframe.
Position-Related Operations
Position information and balance display can always be shown by selecting “Menu -> View -> Show Panels,” or by right-clicking within the chart and selecting from the displayed menu.
However, if you prefer to use buttons for these operations, this section will be relevant.
From left to right, the buttons are: market order, limit order, modify order, close selected position, partial close, close all positions, and delete limit/stop orders.
Position-related operations are crucial for simulations, including entry, stop loss, and take profit. Therefore, let’s proceed to make entries and exits within the simulation environment to see how it works in practice.
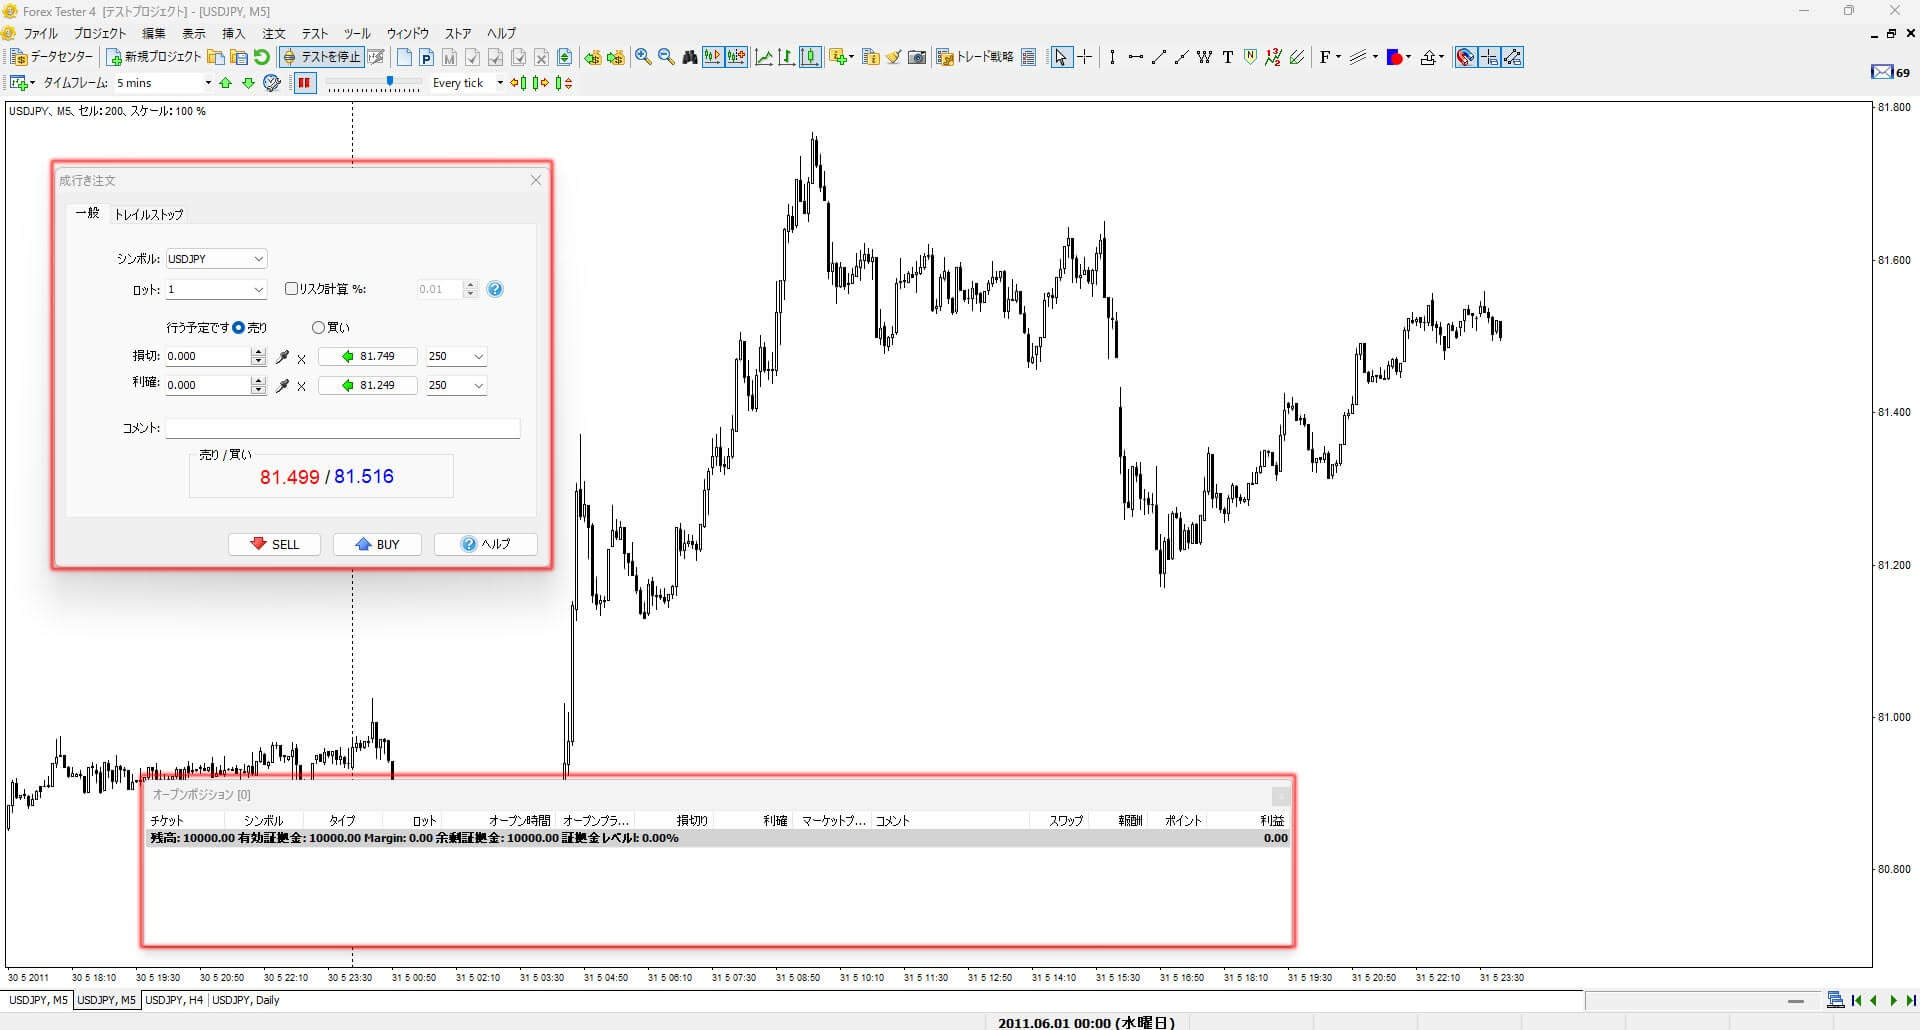
Open Positions at the Bottom of the Screen.
The open positions at the bottom of the screen display position information, which can be accessed from the menu.
This panel can always be displayed, and by right-clicking within the dialog, you can open the entry dialog at the top left, allowing you to place entry orders.
Here is an image of a chart with a test entry.
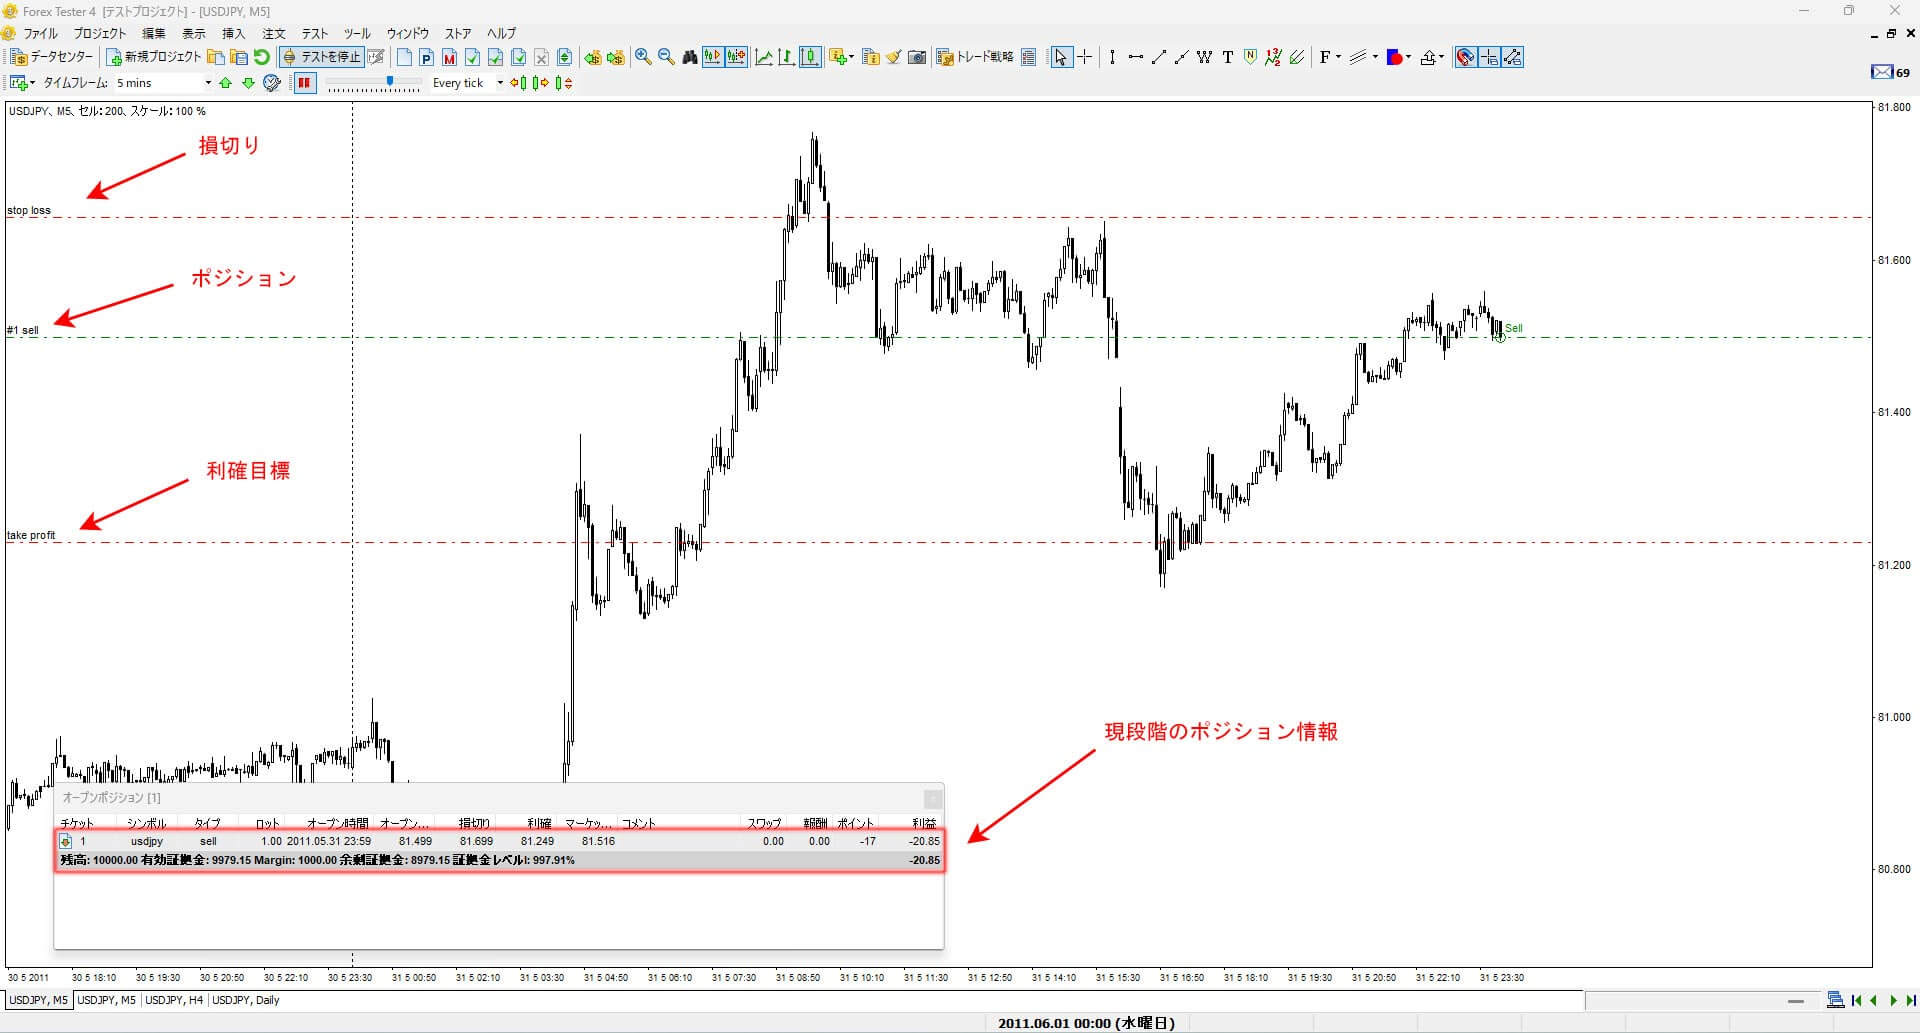
On the chart, positions, stop loss, and take profit targets are clearly displayed with lines. Additionally, all position information can be viewed in the open positions dialog.
You can see that it is very similar to the MT4 and MT5 software used in real trading.
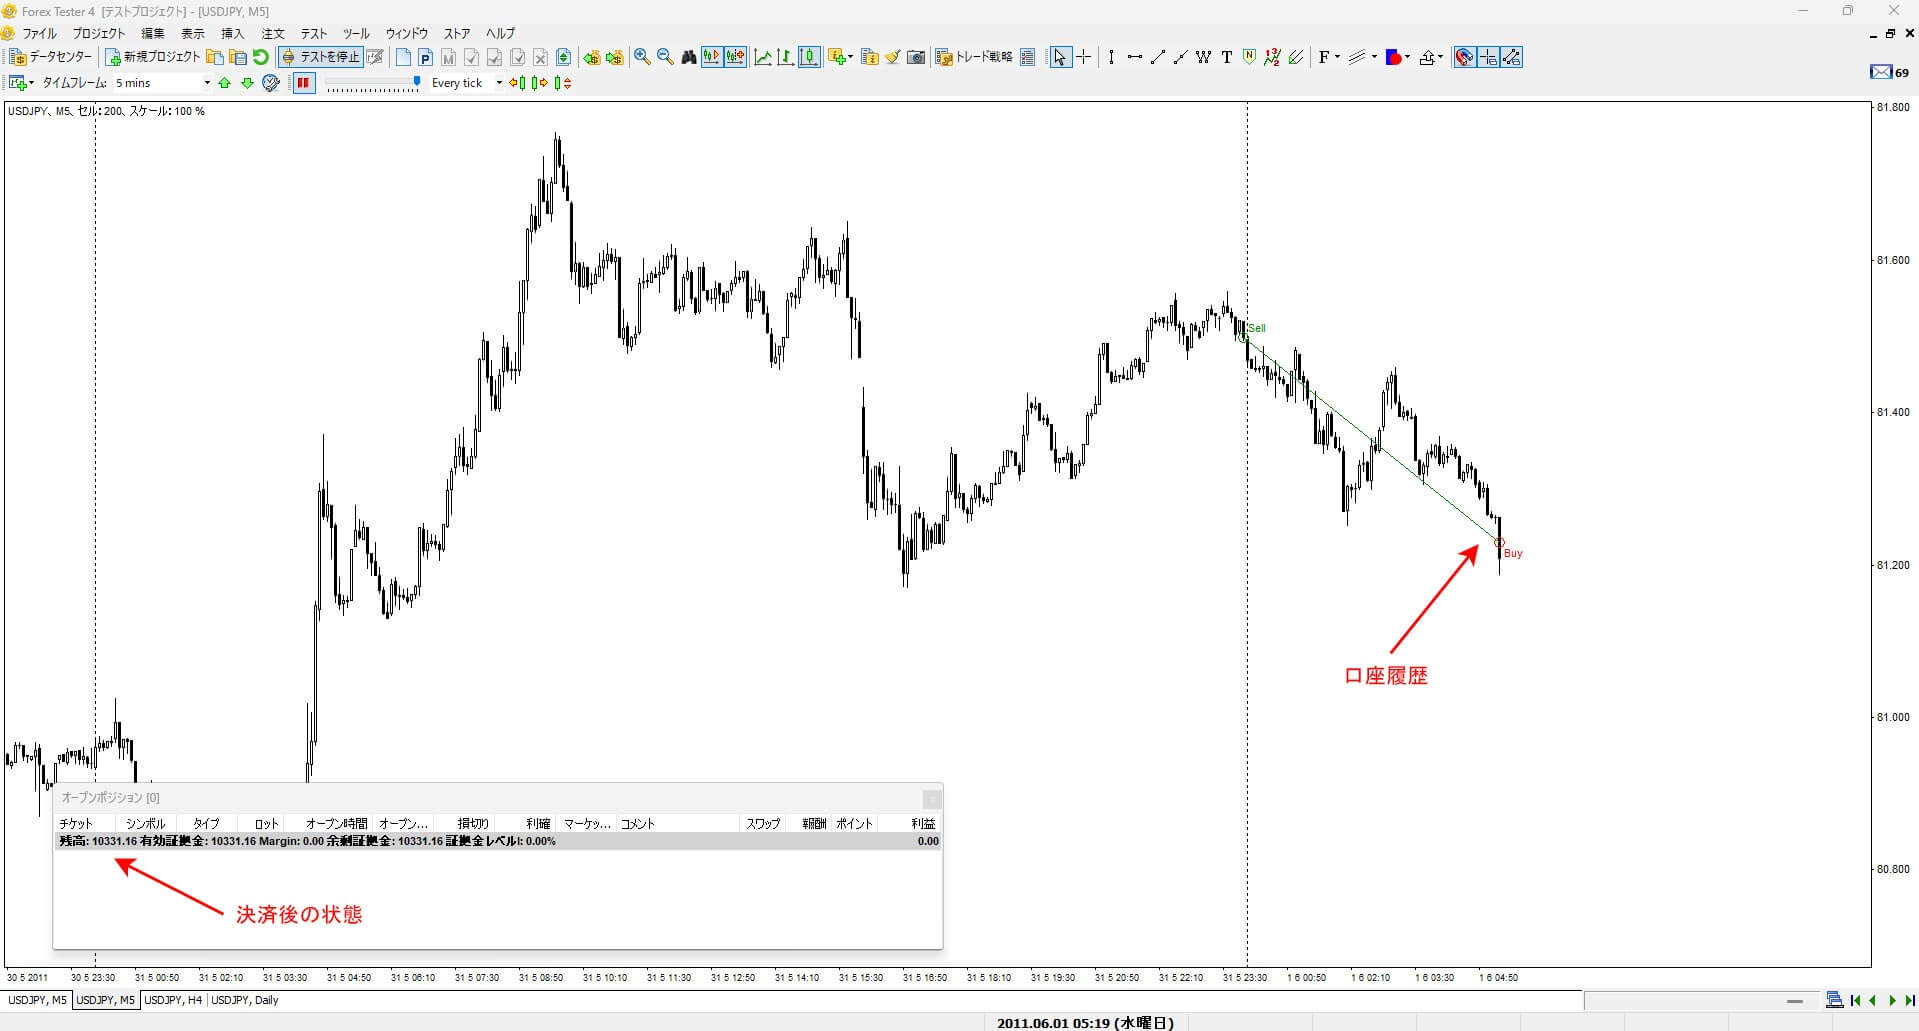
And here is the screen immediately after closing a position.
The account history shows details such as the entry price and the exit price, and you can see that the open positions have been updated to reflect the closed state.
You can easily show or hide the account history using the right-click menu.
During simulations, I find it helpful to hide it to avoid clutter from overlapping lines. After the simulation, I display it again for further analysis.
Zoom In/Out
This adjusts the zoom level of the chart screen.
Drawing Lines
This feature allows you to select basic lines used for analysis, such as trend lines, horizontal lines, and channel lines.
In addition to the default line tools, there are various others available. It is recommended to customize this setting to display only the tools you use regularly.
Other Frequently Used Features
Chart Settings
By customizing these settings to your preference, you can make the chart more readable and understandable, and match the appearance to the chart screen you typically use in real trading.

The chart screen that I have set to my liking will be the following settings.
| Color scheme settings | Black on White |
| Setting | Check Show period separator line and Show buy and sell prices. |
Template Save Feature
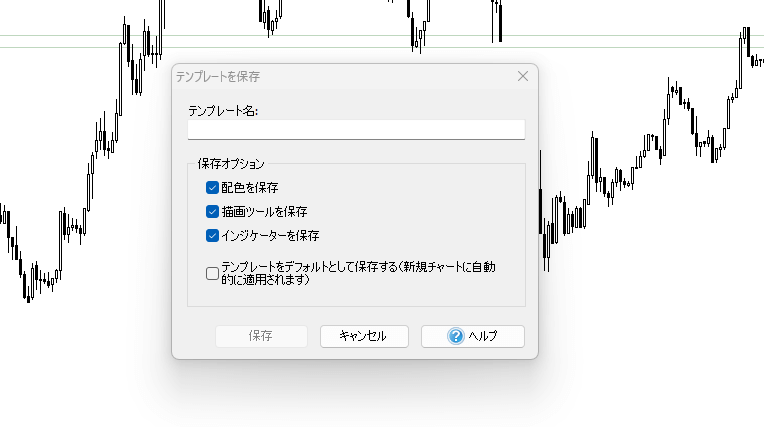
This is another valuable feature.
When conducting backtesting or analysis in FX trading, which you’ll do hundreds or thousands of times in the future, it’s a waste of time to repeatedly set up your standard chart and indicator settings.
However, with this template save feature, you can save your preferred chart settings, including indicators and oscillators. This way, you only need to select the template next time, and it will be applied to any project.
You can save multiple templates with different names, making it convenient to save indicator settings and values used for various trading strategies.
Creating Simulation Result Reports
ForexTester allows for detailed statistical analysis of your simulation trading performance.
This enables traders to review metrics such as win rate, return on investment, and maximum drawdown.
While this example only includes the trial trade, in practice, you can generate reports based on the entire trade history.
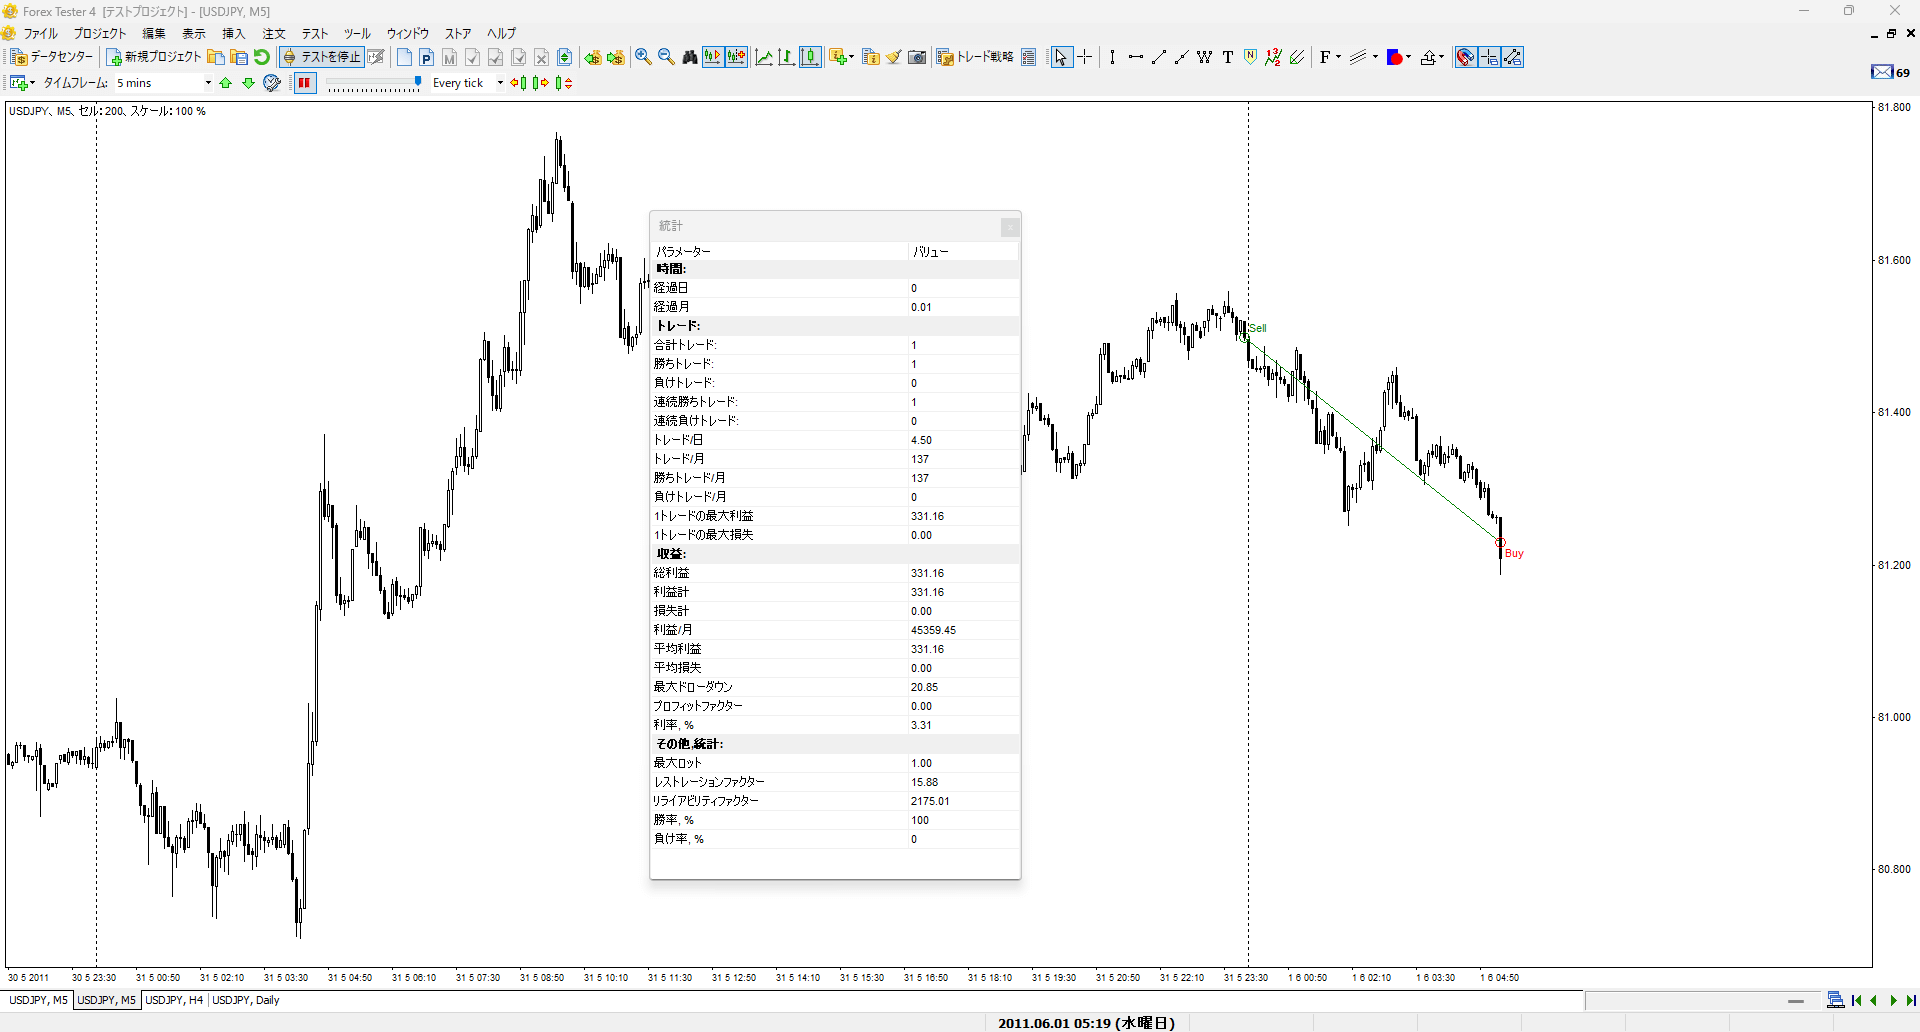
| Main statistical data items | |
| trade | total trade |
| winning trade | |
| losing trade | |
| consecutive winning trades | |
| consecutive losing trades | |
| Maximum profit for 1 trade | |
| Maximum loss for 1 trade | |
| revenue | total profit |
| profit total | |
| loss meter | |
| maximum drawdown | |
| Interest rate (%) | |
| Other statistics | Winning rate (%) |
| Losing rate (%) | |
The above are the items I mainly care about from statistical data.
I included the profits as well, but in actual real trading, profits can be adjusted by the lot size you enter, so it might not be something to worry about too much.
In addition to statistical data, you can also display the “Account History.”

The account history can be shown at any time during or after the simulation.
The purpose of this feature is to review each trade after the simulation.
By double-clicking on the trade history entry you want to review in the account history, the chart will instantly return to the position of the relevant trade, making it easy to review each trade.
By continually simulating, re-analyzing the results, and then simulating again, you can improve the accuracy of your trading strategies.
Forex Tester Usage Guide Summary
In this guide, we explained how to use Forex Tester, a highly-regarded FX simulation (backtesting) software, from the purchase and setting up of the simulation environment to the essential knowledge needed for actual simulations.
While Forex Tester has many more features, knowing just the contents introduced here will be enough to master the software and establish your own advantageous trading strategies.
It’s also reassuring to know that you can purchase Forex Tester from an authorized Japanese distributor (Forex Tester’s official website).
Even if you don’t opt for the paid version, there is a free “trial version” available. For those who want to try it out first, downloading the trial version is a great option.
23 Years of Actual Historical Data
Tick Data for Timeframes Below 1 Minute
Comprehensive Support System

のシンプルトレンドフォロー手法を確立させるまで-150x150.jpg)